 |
Documentation > SXT Observation Notes > this page |
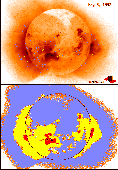
Image name: 8May92_2panel.png (click image to enlarge)
Image size: 255.843 KB (694x993)
Date submitted: 09-Nov-1994

								11/9/94
								LWA

                      THE 8-MAY-1992 X-RAY CORONA

 {It is fun to step through all of the IDL color tables on this figure!}

The upper panel displays an enhanced SXT image of the x-ray corona on 1992
May 8.  North is up and east is to the left.  The intensity range of the
original image is 300,000.  The lower panel illustrates the area
distribution of intensity for four logarithmically spaced intervals.

The north polar hole is very faint, but detectable with SXT.  The apparent
deficiency of XBP in the northern coronal hole is not real but is produced
by the image enhancement procedure.  At the 4 o'clock position about 0.8 of
the way to the limb is a long thin loop with its eastern end anchored in a
faint x-ray bright point.  Strong, et al. (1992 PASJ paper) have shown
that it is common for x-ray bright points to inject energetic particles
into adjacent long loops.  However, the process is quite discrete, as shown
here, and does not result in the heating of very much corona.

The large loop system near the equator at the east limb is an expanding
structure probably associated with a coronal mass ejection.

The lower panel of the figure is included to emphasize how dramatically
the heating of the corona varies from place to place.  The 4 colors
delineate areas wherein the intensity falls within specified
limits as given in Table 1.  The black circle represents the limb of
the sun. White contours separating the colored areas are included for
clarity.  Each intensity step is approximately a factor of 15.

	Table 1  Radiation from the 92 May 8 Corona

Level	     Lower Intensity	Temperature	Fractional	Fractional
	       Threshold	   (MK)		Area		Irradiance
	     (erg/cm2/ster)
Blue		   0		    2.0		0.75		0.095
Yellow		4.7x10^2	    2.2		0.23		0.34
Red		7.0x10^3	    2.8		0.017		0.43
Black		1.0x10^5	    5.6		0.0008		0.13

There is the following rough correspondence between these intensity regimes
and coronal features.

	Blue		Diffuse corona and coronal holes.
	Yellow		Inter-region loops and coronal arcades
	Red		Active regions.
	Black		Hot cores of active regions.

Note that less than 2 percent of this 2-dimensional image is responsible
for over half of the x-ray signal.  If we were able to properly account for
the 3-dimensional structure of the corona the concentration of most of the
emission (therefore, the heating) into a tiny fraction of the coronal
volume would be even more emphasized.  The temperatures given for each of
the intensity bands are an average temperature derived from 1755 SXT
non-flare image pairs -- acquired within 5 minutes of each other over the
first year of the Yohkoh mission (1991 November to 1992 November).