
|
Documentation > SXT Observation Notes > this page |
Image name: ATT_SFT_Compare.png (click image to enlarge)
Image size: 11.0880 KB (750x512)
Date submitted: 21-Aug-1996
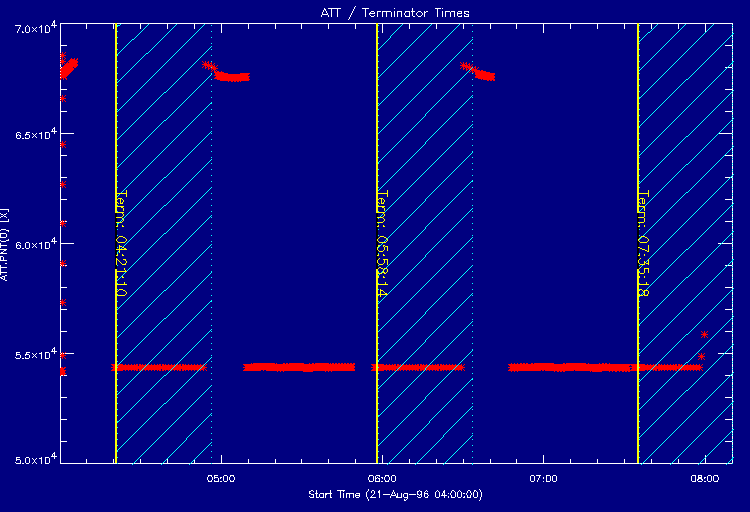
This plot shows the relationship between reported ATT E-W (X) values
and three terminator images taken on August 21.

RED               - reported ATT X values (E-W)
BLUE (diag lines) - Yohkoh night
YELLOW            - SFT (terminator) image times
                    21-AUG-96  04:21:10
		    21-AUG-96  05:58:14
		    21-AUG-96  07:35:18


to produce the plot...
   index(ss) - SFT times on 21-aug-1996 (above)
   att       - ATT records between 04:00 and 08:00 21-aug

-------------------------------------------------------------------------
IDL> linecolors

IDL> utplot,att,att.pnt(0),/ynoz,psym=2,color=2,back=11, $       ;** ATT **
     title="ATT / Terminator Times", ytitle="ATT.PNT(0) [X]"

IDL> fem_grid,/fillnight,ncolor=9                                ;** NIGHT **

IDL> evt_grid,index(ss),color=5,linestyle=0,thick=2,labcol=5,    ;** SFT **
     /vert, label="Term: " + gt_time(index(ss),/string)

-------------------------------------------------------------------------
