
|
Documentation > SXT Observation Notes > this page |
Image name: CCD_CHANGES_I.png (click image to enlarge)
Image size: 773.367 KB (1024x982)
Date submitted: 13-Oct-1996
LWA, 13-Oct-96
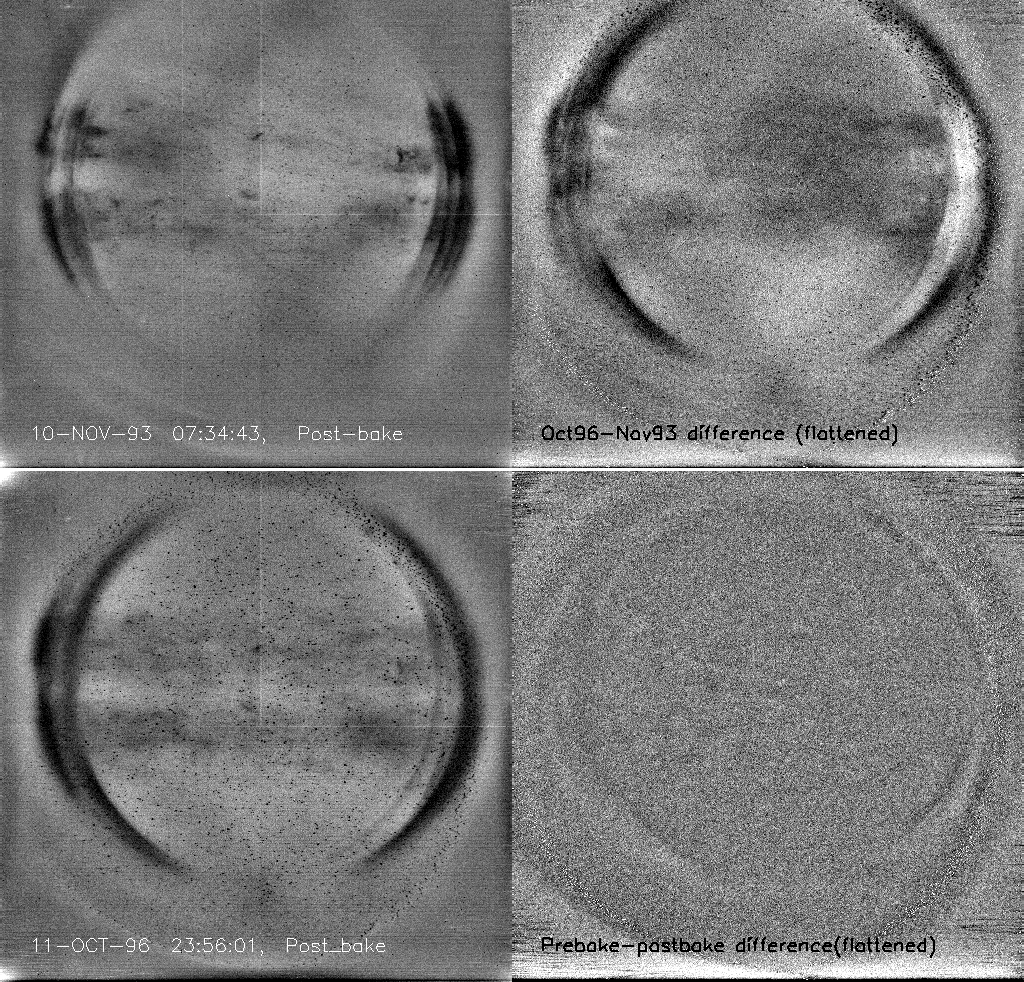
CHANGES CAUSED BY TIME AND BY CCD BAKEOUT - I
This array of images demonstrate the changes in the CCD caused by 3 years
of operation (LH column) and by a CCD bakeout at each of the two epochs.
The LH images were prepared (flattened) with the program SXT_DIFUSER2 from
the pairs of observations indicated by *:
3-NOV-93 08:40:52 QT/H Diffu/Open Half Norm L 4 2.9 512x512
3-NOV-93 08:43:00 QT/H Diffu/Open Half Norm C 4 2.9 512x512
* 10-NOV-93 07:32:35 QT/H Diffu/Open Half Norm L 4 2.9 512x512
* 10-NOV-93 07:34:43 QT/H Diffu/Open Half Norm C 4 2.9 512x512
3-OCT-96 05:14:29 QT/H Diffu/Open Half Norm C 2 1.0 512x512
3-OCT-96 05:15:41 QT/H Diffu/Open Half Norm L 2 1.0 512x512
* 11-OCT-96 23:56:01 QT/H Diffu/Open Half Norm C 2 1.0 512x512
* 11-OCT-96 23:57:21 QT/H Diffu/Open Half Norm L 2 1.0 512x512
Note the evolution of radiation damage in both diffuse and discrete
(specks) features.
The lower RH image is the difference of the Oct-96 pre-bake flattened image
and its corresponding pre-bake diffuser image. The corresponding Nov-93
difference is pretty flat -- with a gaussian histogram. The Oct-96 bakeout
had more non-gaussian structure. Perhaps this is caused by the larger
period between bakeouts (7 months) in this case. The Nov-93 bakeout was
only 3 months following the previous CCD bakeout.
The pointing for the 3 bakeouts was:
482.300 603.800
482.190 603.450
483.590 602.450
483.990 601.950
for the Nov-93 set and
536.180 594.810
536.430 594.790
537.730 592.760
537.950 592.270
for the Oct-96 set. This difference in pointing makes it difficult to
directly compare the intensity pattern for the two cases. However the
difference of the flattened (uppper and lower LH images) images, shown in
the upper right, indicates the 3-year changes in radiation damage. Here
dark means additional radiation damage. It appears that some healing may
have taken place at the west limb area.
The enhanced horizontal streaking in the corners of the Oct-96 difference
image is probably evidence for contamination which orients along the CCD
gate grooves. This was observed to happen in pre-launch studies of
contaminated CCDs.
It should be mentioned that I still do not fully understand why the
diffuser images reveal the pattern of radiation damage.
