
|
Documentation > SXT Observation Notes > this page |
Image name: Dagwood_6yr_lite_curv.png (click image to enlarge)
Image size: 11.7320 KB (768x512)
Date submitted: 24-Sep-1997
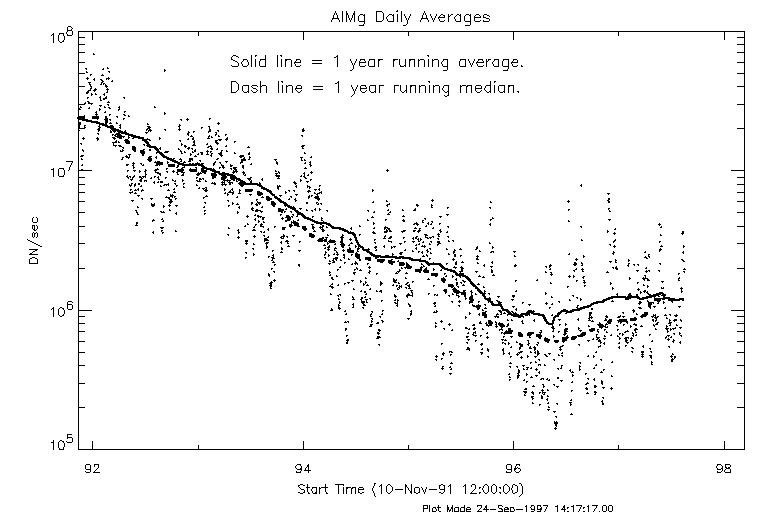
   Daily and annual averages of AlMg full sun signals

The points are daily averages of full-sun AlMg images for the period
10-Nov-91 through 16-Aug-97.  The QR images are normalized to HR signals
by multiplying by 4.  Off points, CCD bakeouts and other pathological
data have been eliminated, leaving 82646 data points covering 2107
days.  There are 76 days in this interval with no data.

These data were collected from the SXL database using program
sxl_analysis2.pro.  I thank Hugh Hudson for running the program for
me at ISAS.

L. Acton  24-Sep-97
