Detection of a Gamma Ray Burst of 19-Apr-1992 by WBS/HXS
Image name: 19920419_0122_hxs_pc12.png and 19920419_0122.hxs_ph.png
(click image to enlarge)
Date submitted: 1-Aug-2011
Description:
Detection of a Gamma Ray Burst of 19-Apr-1992 by WBS/HXS
This article is based on our response to an inquiry (by a researcher at
UC Berkley on 28-Jul-2011) on the availability of Yohkoh/WBS/HXS data
during the gamma-ray burst occurred on 19-Apr-1992.
First, quick description of the WBS/HXS (Hard X-ray Spectrometer).
HXS has a NaI scintillation detector. HXS data consist of two parts:
32-channel pulse height (PH) data (20-400 keV)
2-channel pulse count data (PC1 : 20-50 keV and PC2 : 50-600 keV)
# The energy ranges here are from the pre-flight calibration,
# and had changed gradually with time during the mission.
The time resolution of the data varies depending on the observation mode.
Under some best situation (e.g., during solar flares), they are:
1 sec for PH data
0.125 sec for PC data.
WBS had a capability of gamma-ray burst detection.
When an event with large enough counts rate occurred,
it triggered a high cadence observation:
1 sec for PH data
0.25 sec for PC data.
Unfortunately this event did not trigger a high cadence mode and thus
observed in a lower cadence mode:
8 sec for PH data
1 sec for PC data.
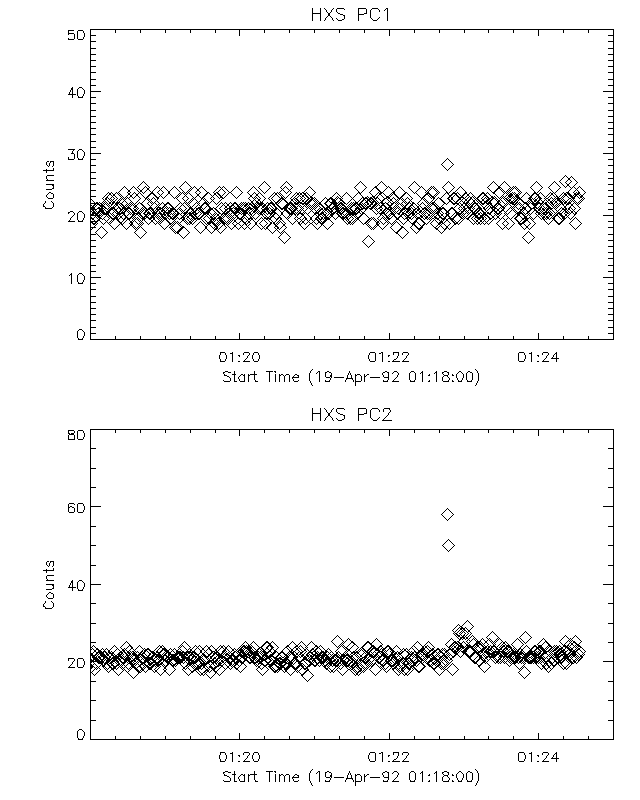
The plots in the above summarize our observation of the event.
- Both of PC plots peaked at 01:22:46.5 UT.
- PC2 plot also shows a small 'hump' around 01:23.
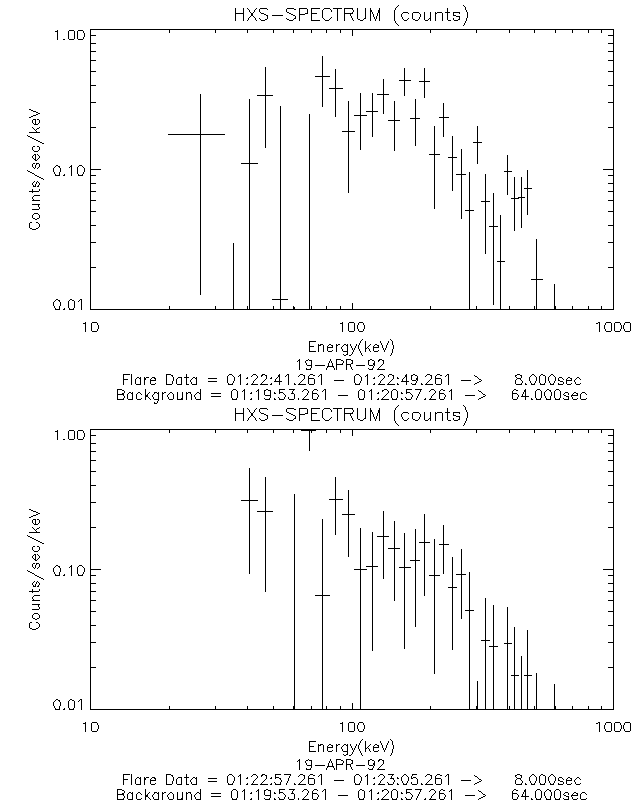
- The PH plots are only from two time ranges,
(1:22:41-1:22:49, 1:22:57-1:23:05 UT).
No significant signals found in other periods.
The HXS-PC2 counts around the peak are:
01:22:45 - 01:22:46 20.3874
01:22:46 - 01:22:47 58.0380
01:22:47 - 01:22:48 50.1923
01:22:48 - 01:22:49 22.0078
The position of the Yohkoh satellite at the PC peak time is :
Latitude : 14 deg.
Longitude: 235 deg.
Height : 564 km (Radius: 6941 km)
These are geocentric coordinates, calculated (interpolated)
from the orbit data at $SSWDB/ydb/orb.
The S/C was entering to night at 01:35:08, so located close
to the line of Sun and Earch (night-side).
- note -
The modified version of MK_HXSPC.PRO (by KY) was used to
make the spectrum plots.
KY, AkT (1-Aug-2011)