
|
Documentation > SXT Observation Notes > this page |
Image name: Orbit_Dark_Changes.png (click image to enlarge)
Image size: 10.8060 KB (1024x512)
Date submitted: 09-Dec-1994
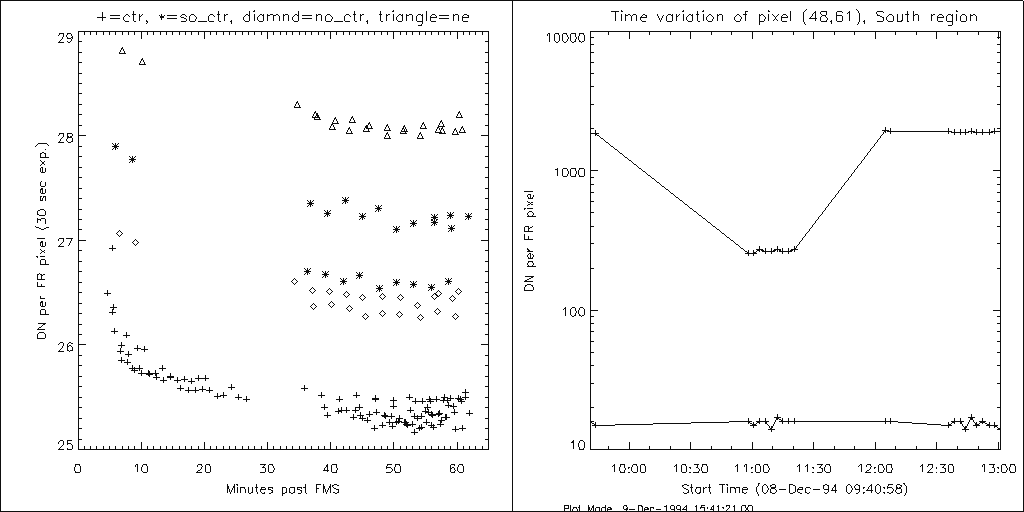
                       VARIATIONS OF DARK SIGNAL

This figure illustrates the variation in dark signal in 4 different
64x64 pfi centered at

     Location  ROIT  N-S  E-W

	ctr     4    128  128
	sth     5     64  128
	nth     6    196  128
	ne      7    196  196

where the N-S and E-W addresses are taken from the ART section of the
ROI table, they are in QR pixels.  All the data were taken with the
standard 2 minute UV flood interval over the period

   ctr   (first, last) = ' 1-DEC-94  14:43:38', ' 8-DEC-94  13:00:14'
   sth   (first, last) = ' 8-DEC-94  09:40:58', ' 8-DEC-94  13:00:46'
   nth   (first, last) = ' 8-DEC-94  09:41:30', ' 8-DEC-94  12:58:46'
   ne    (first, last) = ' 8-DEC-94  09:42:06', ' 8-DEC-94  12:59:18'

Note that all of the curves follow rughly the same shape but have
surprising differences in amplitude.  The sth (south) data actually
follow 2 different curves.  The reason for this is revealed in the RH
plot which shows that a bright dark spike switched to low and then back
to high during the observing period.  The lower curve from pixel (49,61)
illustrates the amplitude and variation of a "normal" pixel.  The
differences in amplitudes of the different pfi locations of the LH figure
really reflects the variations in major dark spike populations of those
particular pfi's.

I have verified these relative amplitudes with a recent DARKCAL frame.

From these data I conclude that the slow orbit variation of dark signal
can be represented by a single algorithm applied to every pixel in a
dark frame.  The same is probably true for the early sharp decrease
but this remains to be verified by experiment -- which I will go and
set up now.

						L. Acton  12/9/94
