 |
Documentation > SXT Observation Notes > this page |
Image name: Orbital_Dark_Variation.png (click image to enlarge)
Image size: 11.6780 KB (512x800)
Date submitted: 29-Dec-1994

						12/29/94
						L. Acton

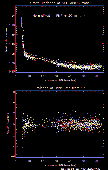
		ORBITAL VARIATION OF SXT DARK CURRENT

The upper plot illustrates the orbital variation of CCD dark current.  It
has been prepared from data taken during the December 1994 dark signal
experiments.  The solid line is derived from a 5th order polynomial log-log
fit to the data.  The lower plot shows the deviation of the data from the
values derived from the fit.

I have placed a detailed report of this work (dark_summ.txt) and an idl
save file on SXT4

	/usr/acton/hdwe/dark_var.sav

This save file contains the x and y data for these plots and the parameters
from the fit.  Here they are for the record:

IDL> help,xxx,yyy
XXX             FLOAT     = Array(849)  {Minutes since FMS.
YYY             DOUBLE    = Array(849)  {Normalized dark current.
IDL> pmm,xxx,yyy
      4.72385      63.4545
     0.960616      1.20744
IDL> parm=poly_fit(alog10(xxx),alog10(yyy),5,yfit)
IDL> print,parm
       1.9883628
      -7.1686219
       10.122472
      -6.9061794
       2.2587795
     -0.28179413

This solution has been prepared for the case of an SXT MORNING INTVL of 4
(128 seconds) and the present 2 minute delay of start of the morning
interval.  For cases with a longer or shorter UV flood or delay interval
the curve must be shifted right or left accordingly.  The dark signal
depends upon the interval beyond the end of the UV flood -- independent of
the duration of the flood.  When preparing the software for orbital dark
current variation it will be necessary to search the observing table files
and extract the data on dates of changes in MORNING INTVL and incorporate
this in the correction algorithm.  Note also that this is strictly a dark
current correction -- over and above the DPE=2 read signal