
|
Documentation > SXT Observation Notes > this page |
Image name: Percnt_T_err_vs_err_in_thin_ratio.png (click image to enlarge)
Image size: 8.12800 KB (768x512)
Date submitted: 30-Oct-1996
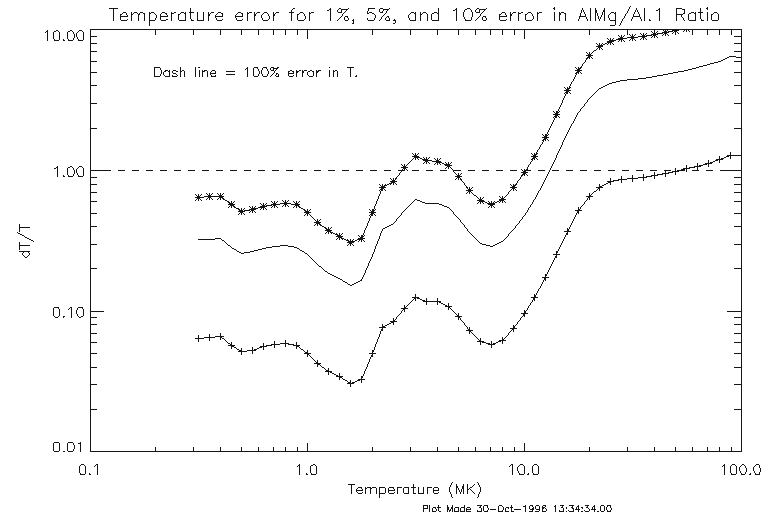
ILLUSTRATION OF TEMPERATURE ERROR vs. RATIO ERROR

This plot is made from the SXT response curves from
sxt_flux.pro by expressing the derivative of
dT/d(ratio) vs. T.  Here is the call used to plot
the result.

plot_oo,10^(tte-6),(deriv(dg/al,10^(tte-6))*0.01)/10^(tte-6),$
ytit='dT/T',xtit='Temperature (MK)',charsize=1.5,psym=-1,$
tit='Temperature error for 1%, 5%, and 10% error in AlMg/Al.1 Ratio'
oplot,10^(tte-6),(deriv(dgsens/alsens,10^(tte-6))*0.05)/10^(tte-6)
oplot,10^(tte-6),(deriv(dgsens/alsens,10^(tte-6))*0.1)/10^(tte-6),psym=-2
oplot,[.1,1e4],[.1,1e4],linestyle=2
xyouts,/norm,.2,.85,'Dash line = 100% error in T.',charsize=1.4

L. Acton  30-Oct-96
