
|
Documentation > SXT Observation Notes > this page |
Image name: Scatter_Correction_Study.png (click image to enlarge)
Image size: 124.887 KB (768x768)
Date submitted: 25-Nov-1995
L. Acton, L. Culhane
24-Nov-95
25-Nov-95 (revised)
STUDY OF X-RAY SCATTERING CORRECTIONS
Presently there are 2 "standard" programs for computing the scattered
x-rays in an SXT image.
SXT_SCATTER (LaBonte) uses a Fourier Transfer technique, has no
temperature dependence and uses the scattering function
Scat = 0.00168*R^(-1.89)
where R is in HR pixels and Scat is the Signal from a source of unit
intensity scattered into a half resolution pixel at distance R from the
source.
SXT_SCATIM (Foley and Lemen) uses a brute force computation of
scatter from every pixel of the image into every pixel of the scattered
x-ray image. This program requires a temperature array in addition to the
input image and uses the Hara temperature-dependent scattering function.
Scat = [0.0024*R^(-2.0)]*(wave0/wave)
where wave is the computed mean wavelength from sxt_mwave.pro appropriate
to the SXT filter and temperature of the source pixel. Wave0 is the mean
wavelength for a reference temperature of 6.94 MK. This program does not
treat the core of the PSF so is only appropriate for scattering at a
distance.
In addition to these 2 standard codes Carl Foley has derived a new
temperature-independent scattering function and has attempted to estimate
the errors for this analysis of this polar coronal hole.
+0.00266 -0.2
Scat = 0.00176 R^(-1.9)
-0.00106 +0.2
Carl's scattering function is essentially identical to the standard used in
SXT_SCATTER. This, or any other power law scattering function can be used
in SXT_SCATTER.
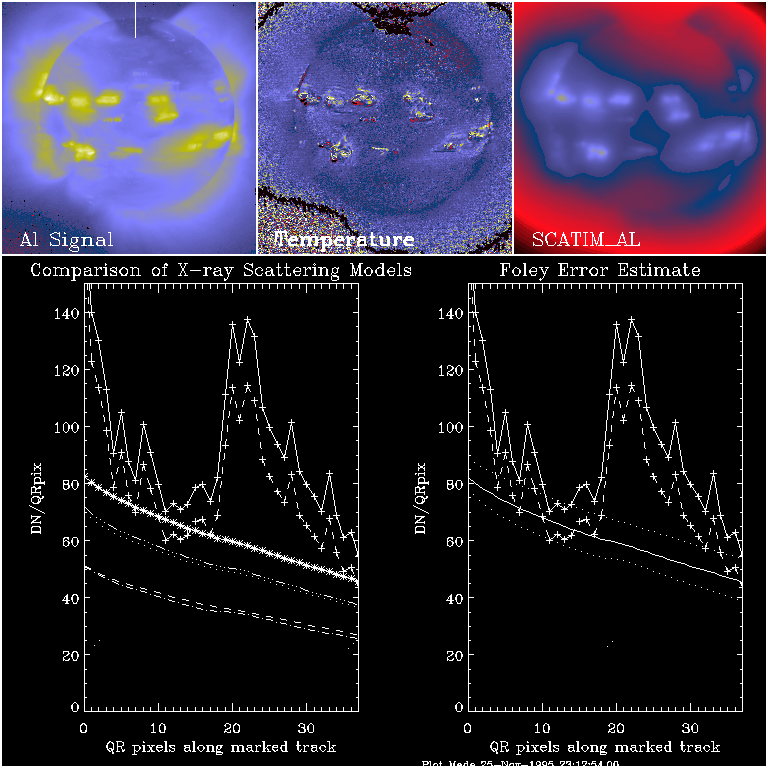
The figure compares the results of several scattering solutions for an Al.1
composite image synthesized from 5 long (75.5 sec total) exposure images
obtained on 3-Oct_92. The 5 co-aligned images were summed and rebinned to
QR for this analysis as SXT_SCATIM requires a 256x256 input.
The upper left image is the SFD_Compressed Al.1 image, the center image is
the temperature map (the black contour shows the cutoff boundary in our
DENOISE test). The image on the right is the SFD_Compressed standard
SXT_SCATIM image with the color table normalized to the same scale as that
used for the input image. The Al.1 image shown here has not been
vignette-corrected but curves for both uncorrected and corrected coronal
hole signal are given in the plot. The short line segment in the upper
left image shows the location of the data samples plotted in the graph.
The 5 curves in the left hand plot show results for the following
scattering models, counting down from the curve with the asterisks:
Top - the standard SXT_SCATTER solution
Second - from SXT_SCATTER with the basic Hara function
Third - uses SXT_SCATIM with an isothermal temperature
image at the Hara reference temperature of 6.94 MK
Fourth - the standard SXT_SCATIM solution
Bottom - the SXT_SCATIM solution with the noisy parts
of the temperature map set to alog10(T)=5.5.
SCATIM_AL_7_MK uses SXT_SCATIM with an isothermal temperature
image at the Hara reference temperature of 6.94 MK
The plot on the right displays the basic Foley function and his upper and
lower error limits.
Note several important points:
1. Agreement between the second and third scatter curves in the left hand
figure shows that the brute force technique and the Fourier transform
technique gives essentially the same result for the same input parameters.
2. Agreement between the two bottom curves in the left hand plot shows
that the noisy parts of the temperature image do not distort the result.
