
|
Documentation > SXT Observation Notes > this page |
Image name: Synoptic_stakplots_South.png (click image to enlarge)
Image size: 468.660 KB (1074x778)
Date submitted: 8-Jul-1995
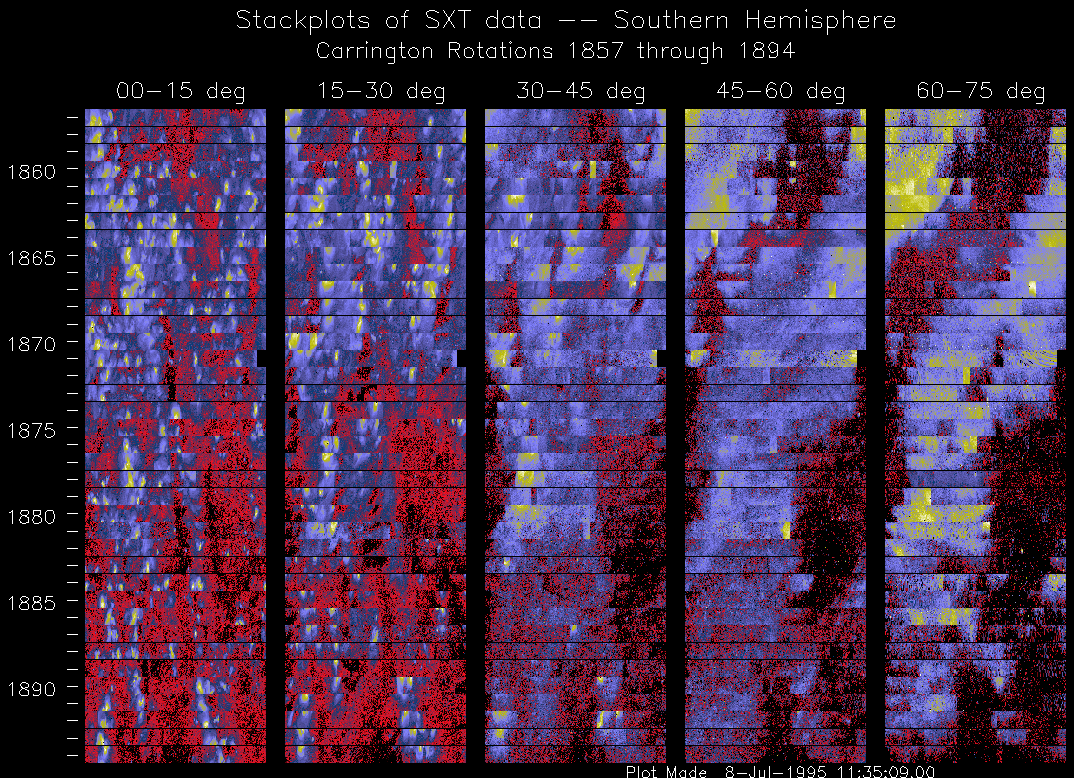
  STACKPLOTS OF SXT SYNOPTIC MAPS

These stackplots were prepared by Mark Weber from
the synoptic maps online at ISAS.  They are made
from the AlMg filter, one image per day.

The effect of differential rotation is quite
interesting.  Note that the synodic Carrington
period is 27.2375 days.

These stackplots were prepared at the request of
Taeil Bai for comparison of some periodicities
in the Ulysses data during the south polar crossing.

                          L. Acton  7/8/95
