 |
Documentation > SXT Observation Notes > this page |
Image name: T_EM_Correlation.png (click image to enlarge)
Image size: 16.1940 KB (850x850)
Date submitted: 22-Apr-1996

                                                           22-Apr-96, LWA

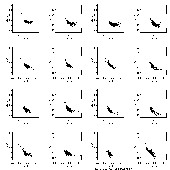
	SPURIOUS CORRELATION OF TEMPERATURE AND EMISSION MEASURE
			FOR SXT FULL FRAME IMAGES.

This figure plots Log EM versus Log T for 16 time periods since the launch of
SXT.  The time intervals of each plot, reading across and down, are given in
the following list.  The earliest time is in the upper left and the latest is
in the lower right.  There are 886 points in each of the 16 plots.  The
filter pairs were all acquired within +/- 10 minutes of one another so some
are doubtless affected by solar changes.  Most of the pairs are separated by
about 5 minutes.

	(first, last) = '10-NOV-91  15:21:01', ' 7-MAR-92  17:22:18'
	(first, last) = ' 7-MAR-92  17:22:18', '29-MAY-92  07:57:44'
	(first, last) = '29-MAY-92  07:57:44', '17-AUG-92  05:00:50'
	(first, last) = '17-AUG-92  05:00:50', '25-NOV-92  23:27:44'
	(first, last) = '25-NOV-92  23:27:44', ' 9-FEB-93  01:10:55'
	(first, last) = ' 9-FEB-93  01:10:55', '17-APR-93  11:13:09'
	(first, last) = '17-APR-93  11:13:09', ' 1-JUL-93  10:37:37'
	(first, last) = ' 1-JUL-93  10:37:37', ' 1-OCT-93  00:23:54'
	(first, last) = ' 1-OCT-93  00:23:54', '21-DEC-93  01:20:09'
	(first, last) = '21-DEC-93  01:20:09', '30-MAR-94  07:54:21'
	(first, last) = '30-MAR-94  07:54:21', ' 9-JUL-94  19:36:39'
	(first, last) = ' 9-JUL-94  19:36:39', ' 5-OCT-94  16:16:31'
	(first, last) = ' 5-OCT-94  16:16:31', '25-JAN-95  16:43:48'
	(first, last) = '25-JAN-95  16:43:48', '25-MAY-95  01:59:45'
	(first, last) = '25-MAY-95  01:59:45', ' 1-OCT-95  01:44:45'
	(first, last) = ' 1-OCT-95  01:44:45', ' 7-FEB-96  20:01:56'

Note that the first 4 plots are pre-filter-failure and the last and part of
the next to last are post-second-filter-failure.

The full-ffi signals used in this analysis are taken from the SXL data base.
I have used every trick I know to eliminate bad data, including ignoring the
DN=1 level of the SXL histograms.  SXT_TEEM was used for the analysis and the
date was used to account for sensitivity changes due to the entrance filter
failures.

You will note a solar-cycle trend of temperature and emission measure, as
reasonable and expected.  However for every time interval there is an inverse
correlation of emission measure with temperature which I believe must be
spurious and result from some calibration error.

I am puzzled as to how to attack this systematic calibration problem.  This
problem is clearly spectral dependent so the simple gain question that
LaBonte brought up recently does not affect these results.  Does anyone have
any ideas???

					Loren Acton