 |
Documentation > SXT Observation Notes > this page |
Image name: Temp_struct_diffuse_corona.png (click image to enlarge)
Image size: 133.513 KB (900x900)
Date submitted: 30-Jan-1995

Date:	       30 January 1995
Subject:	Diffuse Corona

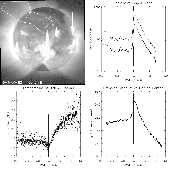
This figure presents some preliminary results on the temperature structure
of the diffuse corona.  The upper LH picture is an example of how data are
selected from an image.  Within the bounded area the data are averaged over
zones equidistant from sun center.  These radial averages for the UL image
and its AlMg mate are displayed at the upper right.  I've done this for the
same general region for 14 pairs of images spanning the period 7-may-92
02:53 to 9-may-92 16:16.  Ratios of the radial averages yield the
temperature vs.  radius info in the lower LH plot -- where the solid line
is the average over 0.5 to 1.5 solar radius, a region sampled in all the 14
pairs of images.  From this average temperature and the average signal
level I derived the column emission measure curve given in the lower right.

This work has to be done again as the sun centers I used turn out not to be
quite right because SXT_CEN did not know that the data cube had been
aligned.  I have to adjust for this somehow in my program RADIAL_AVG which
I use to form the radially averaged values.  However, they are close enough
that the results will not change much.

				L. Acton  1/30/95