
|
Documentation > SXT Observation Notes > this page |
Image name: Variations_in_xray_scatter.png (click image to enlarge)
Image size: 216.882 KB (1250x768)
Date submitted: 01-Dec-1995
L. Acton
1-Dec-95 (revised)
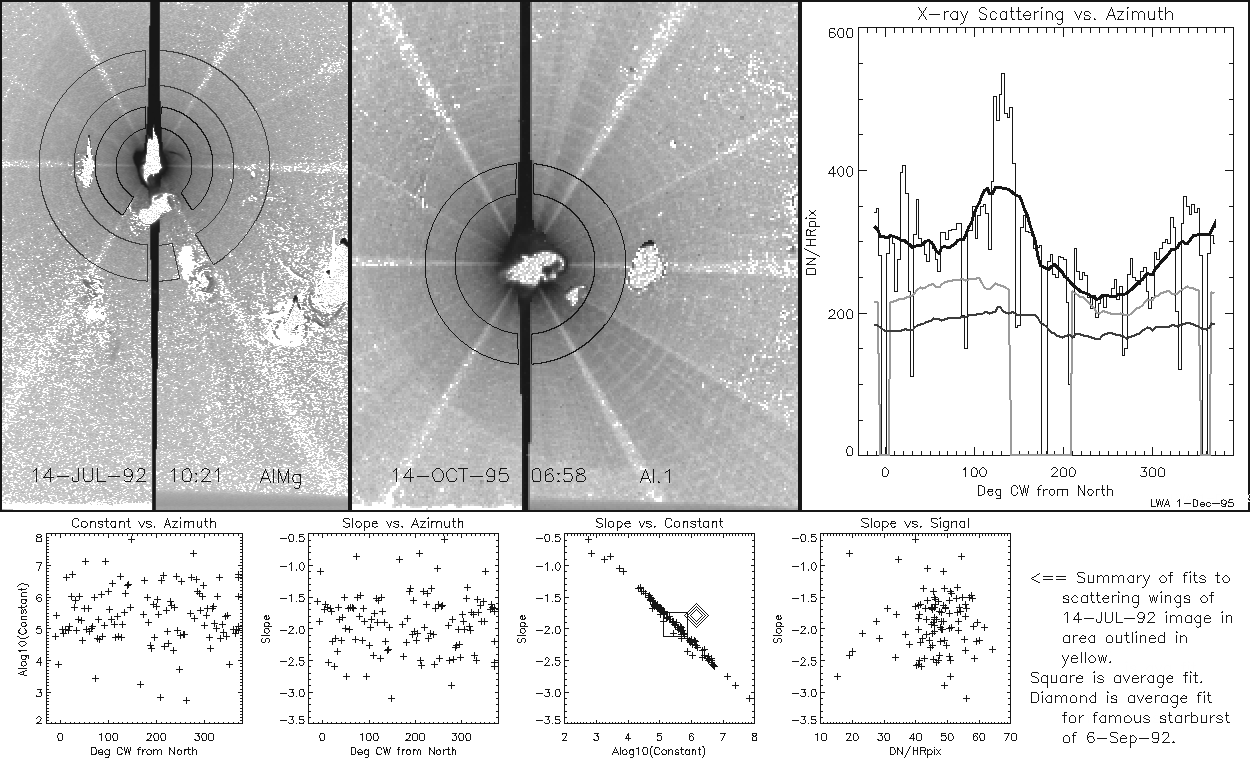
AZIMUTHAL & TIME VARIATION OF X-RAY SCATTER
If there is a strong azimuthal variation in x-ray scatter from the SXT
mirror then the mean scattering correction incorporated in SXT_SCATTER and
SXT_SCATIM may be in error. I have analyzed this for the famous starburst
image of 6-Sep-92 around 18:50 and for the two starbursts shown here.
I have reached the following conclusions:
1. There is an azimuthal variation in scattering -- initially of about 10%
and now as much as 50%.
2. The azimuthal variation of scattering in the far wings is the same as
near the source.
3. The azimuthal variation of scattering through Al.1 and AlMg are the same.
4. There is no evidence for a systematic correlation of scattering slope
with azimuth nor with scattering intensity.
5. There is a remarkably strong linear correlation between scattering slope
and the log of the constant factor of the fit. I do not understand the
reason for this but it is definitely real.
6. There is a definite change in the azimuthal profile of scattering
between 1992 and 1995. The pattern strongly suggests this change is
limited to certain sectors which in turn suggests that it is related
to entrance window failure. This is probably simply due to the
increased x-ray transmission of the entrance filter in those sectors.
The increase of scattering and the transmission of the entrance filter
are roughly commensurate.
The areas outlined in the images are the areas analyzed. The analysis was
done with the program SECTOR_AVG.PRO in 3 degree segments. The plot shows
the derived scattering intensities for the 14-Oct-95 image in histogram
form. The heavy solid white curve is a 60 degree smoothing of the
histogram data, deleting the excluded azimuthal bins. The prominent bright
ray near the north and in the SW 30 degree sector is evident.
The blue line corresponds to the smoothed scatter in the region of the
14-Jul-92 image outlined in white. The yellow lines is from the outer
region outlined in yellow. The analysis of scattering slope/amplitude
fits given in the plots at the bottom are taken from the yellow region.
The normalization of the blue and yellow curves are arbitrary, for
convenient viewing on the plot.
Finally, Carl Foley and Hugh Hudson are looking into mirror scatter theory.
Initial communication with L. VanSpeybroeck indicates that the scattering
wings of the SXT mirror are probably from dust rather than from mirror
figure or roughness.
