
|
Documentation > SXT Observation Notes > this page |
Image name: hxa_scan_signal.png (click image to enlarge)
Image size: 6.15400 KB (900x400)
Date submitted: 06-Sep-1996
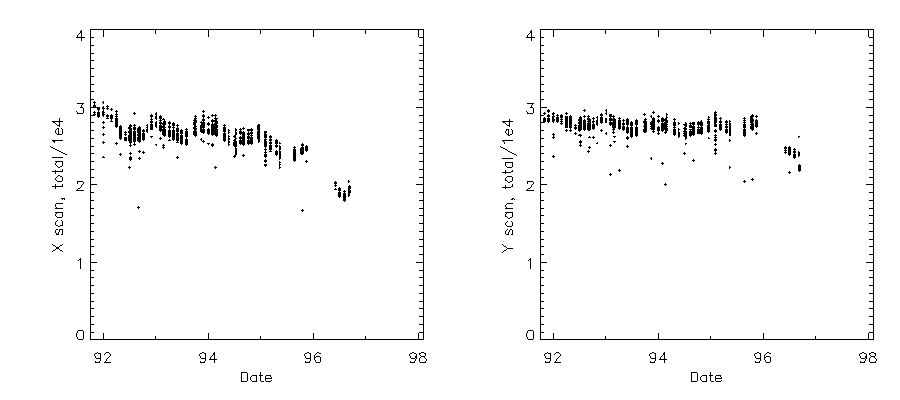
Plots of HXA total counts in the X scan (left) and Y scan (right). The
data prior to 1996 come from flare data sets.

HSH 6-Sep-96


; IDL Version 3.6.1c (OSF alpha)
; Journal File for hudson@isass1.solar.isas.ac.jp
; Working directory: /fdat
; Date: Fri Sep  6 12:00:29 1996

fmt_timer, hxa_scan
ndat = n_elements(hxa_scan)
xtot = fltarr(ndat)
ytot = xtot
flag = intarr(ndat)
for i = 0, ndat-1 do begin
  xtot(i) = total(hxa_scan(i).x_scan_int)
  ytot(i) = total(hxa_scan(i).y_scan_int)
  if n_elements(where(hxa_scan(i).x_scan_int)) gt 500 and $
    n_elements(where(hxa_scan(i).y_scan_int)) gt 500 then flag(i) = 1
endfor
ss = where(flag and xtot lt 3.1e4 and ytot lt 3e4 and xtot gt 1.5e4  $
  and ytot gt 2e4)
!p.multi = [0,2,1]
utplot,hxa_scan(ss),xtot(ss),psym=1,symsiz=.3,yr=[0,4e4]
utplot,hxa_scan(ss),ytot(ss),psym=1,symsiz=.3,yr=[0,4e4]
!p.multi = 0
clearplot
clear_utplot
end
