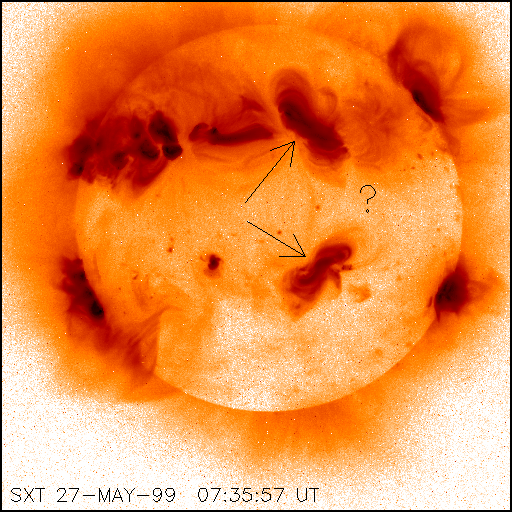
The arrows point to the sigmoid active regions, neatly an "S" in the South, and an "N" homologue in the North, according to standard solar labeling practice. The question mark shows the place at which trans-equatorial interconnecting loops should appear, if they could have formed.
Q. Why didn't they?
A. There is more to life than magnetic reconnection! See Canfield
et al. (1996).
But the main point here is the use of the sigmoid signature as a means
of predicting CME occurrence. These
two cleanly-defined sigmoids are destined to create CME-launching flares,
according to abundant research, for example the Yohkoh
SXT comparisons with SOHO coronagraph data. The metaphor used here
(cannons) updates an quote attributed to A. C. Sterling in the recent NASA
press release on the sigmoid -> eruption morphology. Incidentally, the
large structure on the NW limb (upper right) was yet another major sigmoid
when on the disk. The foreshortening of the structure and the transparency
of the corona to X-rays makes the sigmoid pattern obscure at such a position.
The eruption of this sigmoid apparently took place when the region was
almost directly facing away from the Earth and made a "halo CME."

This significance of this figure might not be immediately obvious, but the arrow on the difference image points to a "dimming" of the sort associated with CME launching, and in fact the wisp of brightening just to the left of the dimming region no doubt is a part of the "post-flare loop" structure, but on an extremely large scale given the flare position some 80 degrees around the limb. The mysterious vertical features are all meaningless artifacts resulting from detector saturation and should be ignored.
Q. When did these cannons discharge, and was the Earth haplessly in
their sights when they did?
A. See below!
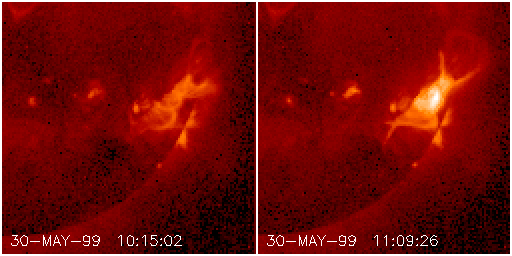 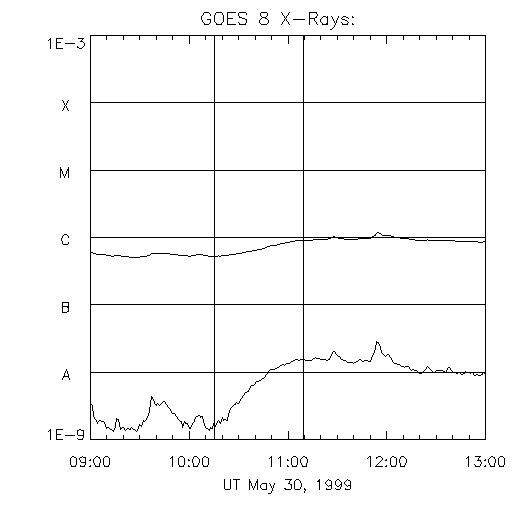 |
This before-and-after comparison (left) is interesting, because in this case the sigmoid did not appear to restructure very much during the event. That is, brightening occurred apparently in existing features, or at least features quite nearby each other. The vertical lines in the GOES plot on the right show the times of the SXT images.
The northern sigmoid erupted on June 2, and unfortunately Yohkoh missed the interesting part of the event because of orbit night. This happens, of course, far more often that the simple statistics might suggest. The GOES plot below shows the timing of images, in the pattern of the weekly plot at the top of this page.
We'll forego the pleasure of commenting on the lack of interconnecting loops, and defer that to some future science nugget. Alas! There are many things to discuss, and only one opportunity per week!
|
|