A Lyman-alpha "Rosetta Stone"

Science Nugget: July 30, 1999

1. Introduction

Lyman-alpha is the strongest resonance line of the most abundant element on the nearest star to us, and yet prior to TRACE there had been almost no systematic observations of flares in this line. We got a good one this week, both with TRACE and also with Yohkoh, and this science nugget describes the beginnings of data analysis. We believe that there will be many papers written on this single event!

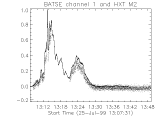
The flare involved the whole panoply of phenomena, ranging from hard X-rays to meter waves, plus eruption and a CME. It was well-observed by Compton GRO as well as by TRACE and by Yohkoh. Here is a glance at the hard X-ray light curves:

This shows both the BATSE low channel (nominally 25-50 keV, and quite free of "thermal contamination", and the Yohkoh/HXT M2 channel, 33-53 keV. The plot shows the data gap that Yohkoh suffered due to a telemetry reading, but they do sample the interesting parts of the rise phase well, including the gradual increase at about 13:24 UT.

2. Comments on the TRACE observations

There has been no time to prepare images, but the TRACE data are very complete in Lyman-alpha. Since the flare is seen off the limb, the experts think that the main response is in this line, rather than in adjacent continuum These data show many of the expected phenomena - eruption, flare footpoints, arcades with downward-streaming "coronal rain." Even more exciting than this, the TRACE 171 and 195 EUV channels both show hot response that can be attributed to radiation sources not in the nominal passbands. These hot sources - probably continuum in the 171 channel, and FeXXIV in the 195 channel - occur near in time to the impulsive phase (see the figure above to define it) and represent the hottest, newest, most extreme corona.

3. Comments on the Yohkoh observations

An empirical overlay showing HXT contours for three time intervals with (upper) SXT intensity maps, and (lower) SXT filter-ratio temperatures:
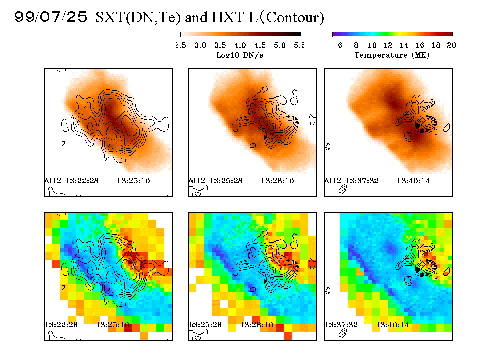
Because the coalignment is empirical, the interpretation is not perhaps so straightforward. However the HXT L band, nominally 15-23 keV, actually has substantial response to thermal sources in the 15-20 MK temperature range. So does SXT, and so does TRACE (see below). So we believe that we have an excellent opportunity here distinguish the hot, "superhot", and non-thermal sources.

4. Directions to go

The first flare comprehensively observed at Lyman-alpha, and with good spatial resolution, has produced an array of expectable and unexpected observations. We are very fortunate to be among the first to view these data and to try to draw conclusions, but of course some painstaking work must precede the sweeping generalizations we'd like to make! In this section we just suggest some directions for future research.

  • Velocity fields. Between the photosphere and the middle corona one has a temperature range of about a factor of 250; within this range a given spectral line may sample a range of a factor of two effectively (this would be its "temperature contribution function"). So we would need a dozen or so independent looks at emissions forming at different temperatures to get a complete view; any given emission line "illuminates" only a small part of the coronal structure. With this flare we get our first look at Lyman-alpha temperatures. This line is very optically thick, so its contribution function in temperature probably is much wider than most; hence it can show us motions in spectral domains we couldn't see well before. Magnetic reconnection in the corona implies an implosion, as the volume of field decreases during energy conversion. These data could show the predicted implosive motion.

  • Post-flare loop system. We think we understand quite well why the Lyman-alpha movie shows new material magically appearing at the tops of the arcade loops. It is "coronal rain," a phenomenon well-known from H-alpha. The hot high-pressure loops responsible for soft X-ray emission gradually cool off, and suddenly undergo a transition to a lower temperature because of the thermal instability pointed out by Field and Harm. The condensed material then cascades out of the corona. No doubt the general picture is well-understood, but with these data we get an exquisite view of the instability in progress and can learn a great deal about the physical conditions leading to it, and about the dynamical effects resulting from it.

  • High temperatures. The TRACE "low-resolution" movie at 195 A (nominally FeXII) shows a high-temperature source, as predicted by Golub et al. (Solar Phys. 122, 245, 1989) resulting from an FeXXIV transition. This filter jumps from being a low-temperature map to a high-temperature map, if the foreground/background confusion is not there. This is extremely exciting.

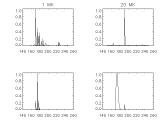
    For the continuum in the 171 channel, it's even more exciting, because in either this flare or some other flare we may be able to image the "superhot" component (> 30 MK) with TRACE's exquisitely small 0.5" pixels. We show this possibility in the figure below:
    B. Handy (handy@isass1.solar.isas.ac.jp),
    H. Hudson (hudson@isass1.solar.isas.ac.jp)
    J. Sato (sato@nro.nao.ac.jp)

    July 30, 1999