
|
|
|
|
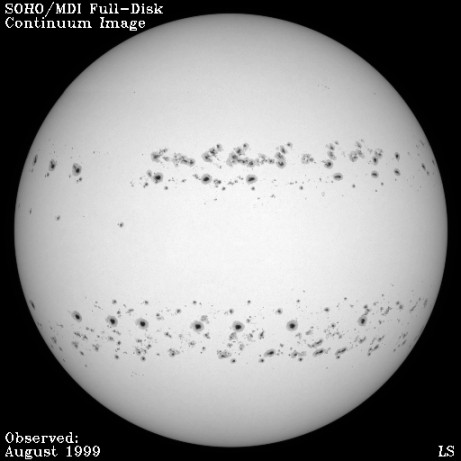
Pleased by this, Sam Freeland has been routinely making soft X-ray time-lapse composites. This has not been done much before, especially not with such regular and lengthy data set as what Yohkoh provides. A viewer with a broadband connection can look at any number of these images on Sam's composites page, but we have extracted the one corresponding to the white-light image above and show it below:
These composites (which indeed look a bit like bangles when presented like this!) cover the months of April-December 1998, and the back-and-forth tilt of about 7.25 degrees is pretty obvious. The persistence of the favored latitudes is quite striking as well; this is part of the "butterfly diagram" as sketched in the next section.
The solar "P angle," representing the tilt of the solar rotation axis to left and right in the plane of the sky, doesn't appear in these images. One might wonder why this larger angle isn't so obvious. The answer is that current solar-imaging satellites, such as Yohkoh, simply follow the P-angle motions by continuously orienting towards solar north - as best they can - thus eliminating the P angle by brute force.
Taking the next step with these daily images, we have collapsed them in the EW direction to make one-dimensional summed images, 1 pixel wide by 512 pixels tall, and then lined them up to form a single image:
But be careful if you click on this image - it's huge. This example of "helioexalepidoptery" ("exaHz" is the frequency of a soft X-ray photon) is a bit crude, but does cover the approximately 3,000 days between late 1991 and late 1999. It shows the butterfly drift of the active regions, the annual nodding motion due to B-angle variation, the "lopsided Sun" phenomenon resulting from times of little activity on one hemisphere, plus lots of artifacts. We will present a more carefully done helioexalepidoptery image in some future nugget.
Note: the spinning Sun at the top of the page was created by Dave McKenzie and copied from Mark Weber's home page (PhD December, 1999, MSU).
February 4, 2000
H. Hudson (hudson@isass0.solar.isas.ac.jp)