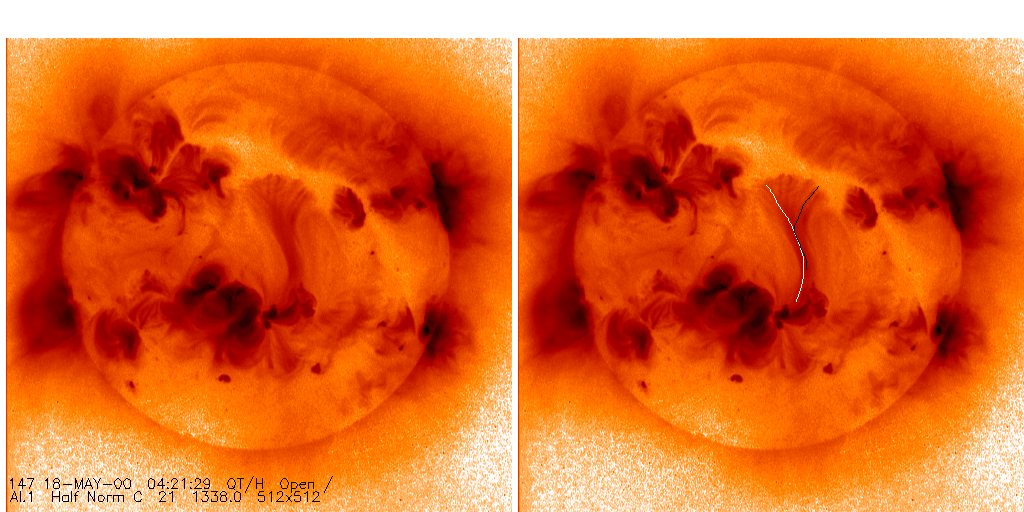
Dr. Joe Khan, a member of the Yohkoh team from the Bent Crystal Spectrometer instrument team here at ISAS, showed me a nice image on which it might be easy to identify the foot-points of TILs. The left panel in the following figure (click to enlarge) is the image. However, as I looked more at the image, I felt increasing difficulty to trace the loops, which are quite diffuse (see the right panel). There may be several loops including those indicated in white and black lines. Generally, tracing an SXT loop is not easy especially when it involves magnetic shear. Looking at the SXT full-disk movie, Dr. Farnik and I agreed that the basic structure of the TILs was already present two days earlier and that repeated brightenings occurred. The image represents the slow decay of one of the brightenings.
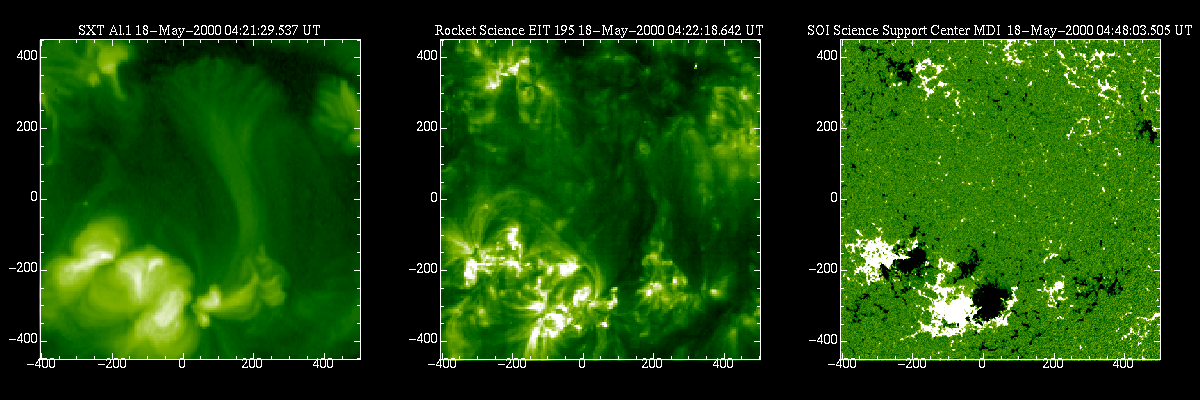
Last time I dealt with TILs, it was clear that they were anchored in the vicinity of regions of strong magnetic field, and that they were too hot to be seen in EUV instruments like EIT on SoHO. The next figure (click to enlarge) gives an extraction of the above SXT image, co-aligned with a nearly simultaneous EIT image and an MDI magnetogram. It seems that the northern legs of these TILs are close to a positive polarity (white) area and that the northern legs to a negative polarity (black) area. The EIT image does not even show a trace of the TILs.
We would like to know how the TILs formed and how they became fainter. The following movie shows SXT full-disk images together with EIT images taken closest in time. The flickering of the SXT images is due to the fact that they are in either thin Al or AlMg filter. Two brightenings of the TILs (around 23:30 UT and 01:30 UT) are captured in this movie. In the former event, the EIT images show a large-scale disturbance from the active region south of the TILs to north or northeast. It is not clear what roles such disturbances play in magnetic reconnection. TRACE data, with better spatial and temporal resolutions but smaller fields of view, often show small-scale activities, which probably represent legs of the loops that undergo large-scale disturbances. This movie also confirms that the TILs do not show up in EIT data as they become hot or cool. The lack of EUV signatures is also applicable to smaller scale loops.

The absence of the SXT TILs in earlier and later EIT images suggests that their heating and cooling both may occur faster than the typical cadence of 10-15 minutes. Their origin may be like a flare. TRACE may show these things with better time resolution, although I don't recall seeing them.