We hope to write two science nuggets on the X-class flare of September 24, which broke a month-long drought in which some 50 M-class flares occurred, but never a major one. This behavior is unusual, and so was the flare that ensued. We will describe why we say that, but first point out that this is our first opportunity to intercompare Yohkoh data with hard X-ray photometry from the new Czech-built Hard X-ray Spectrometer (HXRS for short; this link shows the instrument and also provides access to its data). Before the tragic destruction of the Compton Gamma-Ray Observatory with its BATSE instrument, we often used these data to examine the inevitable gaps in Yohkoh data coverage - gaps happen for various reasons, but can't be avoided when the Earth obscures the Sun, something that happens 15 times a day for a satellite in low Earth orbit.
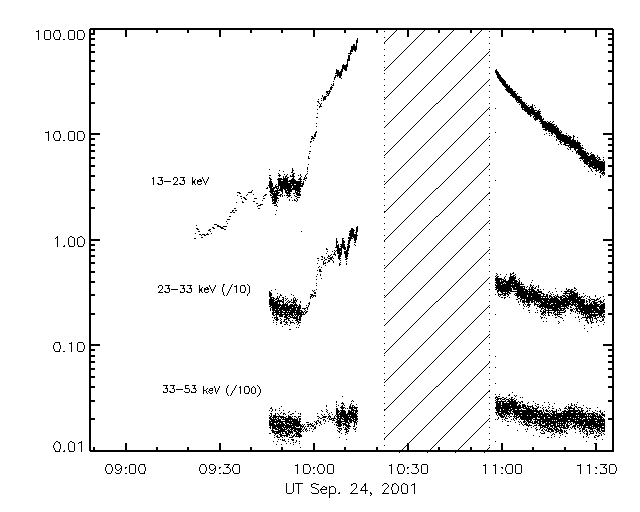
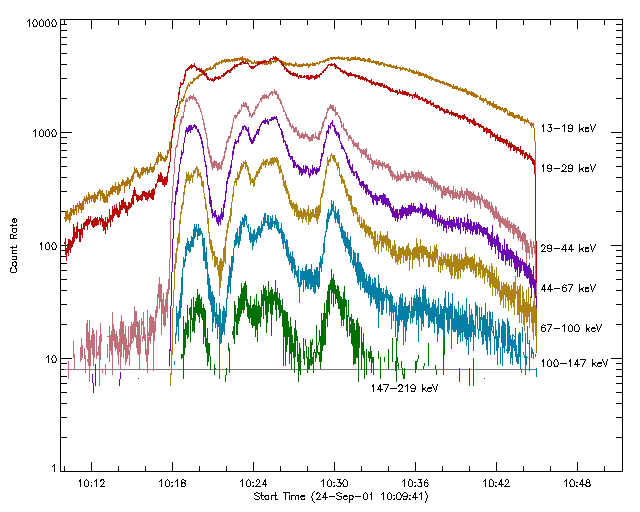
Here's a look at the hard X-ray time histories for the September 24 flare from two instruments, Yohkoh's HXT and HXRS (as usual with these displays, you must click on the image to see it well):
In strict accordance with Murphy's Law, the Yohkoh data have a day/night gap exactly at the wrong time, as though it had been pre-ordained. However, not HXRS - although its data stream has even more gaps than Yohkoh's because of its higher-inclination orbit and the presence of geomagnetically trapped particles - in this case Murphy's Law for once failed. The HXRS data beautifully match the Yohkoh data gap, and there is even some overlap in which we can compare and calibrate. Note from the plot on the right, if clicked, one can read off the energy bands of HXRS. An aficionado of hard X-ray spectra can also see at a glance that even a 1-mm Al entrance window won't totally exclude those thermal soft X-rays!
Discovery of a soft-hard-soft discrepancy
We've done an earlier science nugget on the manner in which the spectra of impulsive hard X-ray emission spikes vary. Normally, the bigger the flux, the harder the spectrum. That's what this event shows too:
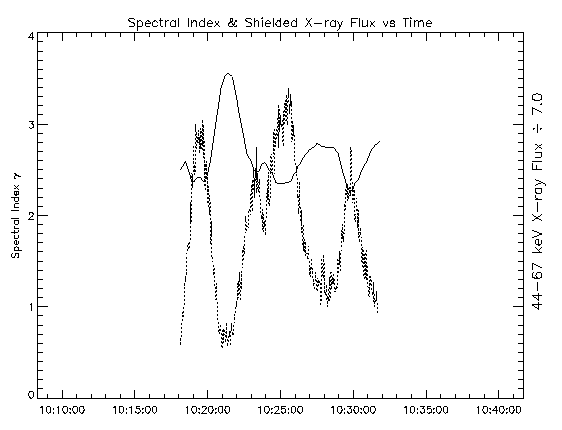
showing the expected mirror-image variation ("soft-hard-soft") of the slope of the spectrum and of its flux (dotted line).
However here we see a strong hint of greater complexity, via hard/soft correlation plots for the first two spikes during the event:
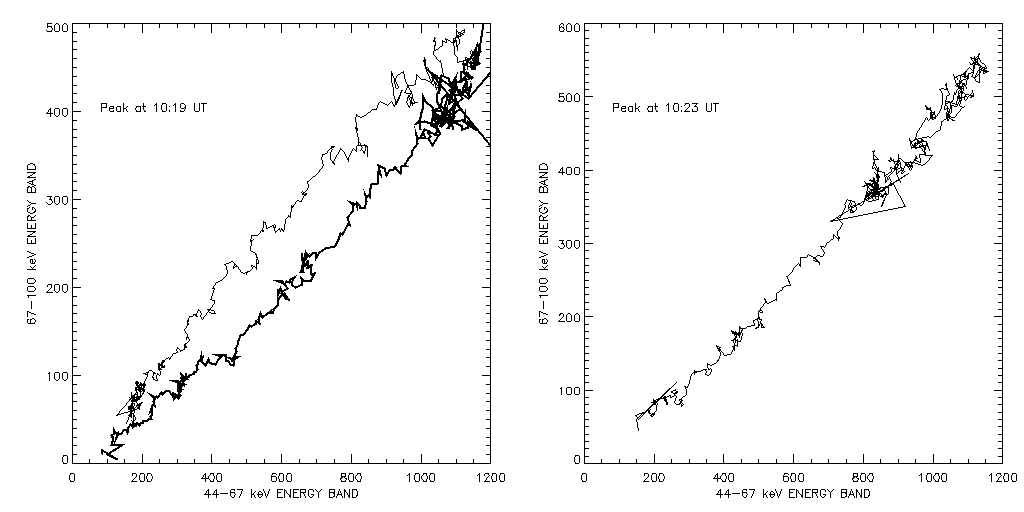
These plots show simple correlations of the two HXRS bands 44-67 keV and 67-100 keV. As time evolves in the first peak (at about 10:20 UT), the counts vary out of phase - the hardness of the spectrum increases during the spike. The lower branch of the loop is the rise phase, the upper branch the decay - it's harder than the rise because this loop is open in the counterclockwise sense. The rise phase is shown as a heavy line. This plot looks nice and fractal for no known reason. The open loop for the first spike (left) is a bit unusual, as is the relatively slow time scale of the evolution. So far as we're aware nobody has studied these effects in detail, but they surely have something to tell us about how particle acceleration works in a solar flare. This simple kind of plot is not seen much in the literature, incidentally - we did a quick search of papers by pioneers C. J. Crannell and J. Karpen and didn't find any (see Fletcher and Martens for related theory).
New information on pre-flare hard X-ray behavior
The HXT spectra from the early phase, prior to the "real" impulsive phase at about 10:18 UT, also show us something interesting. Here the hard X-ray spectrum fits a thermal model better than a non-thermal one.
We compare the lowest hard X-ray channel with the higher of the two GOES photometers in the plot below:
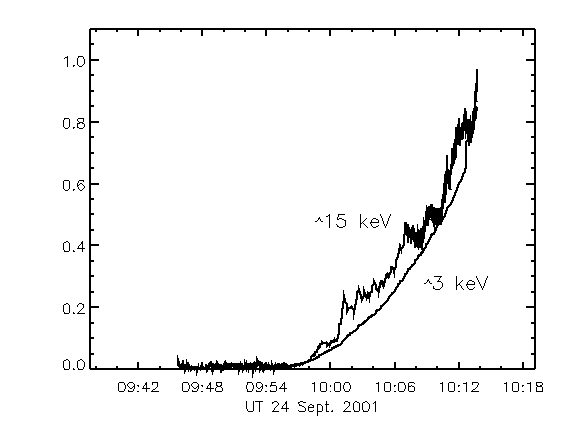
Note the extra variability at the higher energy. This is not noise, because it's also seen in the other HXT energy bands (see the fuller plot at the top of the page). So... something sort of non-thermal is happening, ie rapid time variations. If we interpret the HXT signal as a thermal spectrum produced by a Maxwellian particle distribution (not expected at these particle energies in the corona if it's varying rapidly), what do we get?

This hasty plot just shows the ratio of the 23-33 keV to 13-23 keV channels of HXT, an observational quantity monotonically related to the plasma electron temperature. We show this approximately on the left. The "temperatures" HXT observes far exceed those reported by GOES. Are they properly interpreted as something thermal, or is the distribution function of the plasma being driven away from a thermal state? How is this related to the pre-flare development within the active region?
Again a single flare event seems to be providing us with key clues to how flares originate and develop. We're pleased that the HXRS and Yohkoh data fit so well together and can be analyzed.
Here is how we assess this new capability:
Here is how we may proceed:
September 28, 2001