Hard X-ray and UV emissions in flares
Science Nugget: October 19, 2001
Introduction
For many years, we have known that the initial phase of solar flares
is characterized by hard X-ray (> 10 keV) emission whose intensity
changes with a times scale of less than a second to tens of seconds.
This "impulsive" phase typically coincides with a rapid brightening in
H , called
the "flash" phase. Both of these phenomena are attributed to the
interaction of non-thermal electrons with solar atmosphere below
the corona. According to the scenario that has prevailed over the past
two decades or more, these electrons are somehow accelerated at or
above the flare loop (seen in soft X-rays), and emit radiations in
various wavelengths through various mechanisms.
, called
the "flash" phase. Both of these phenomena are attributed to the
interaction of non-thermal electrons with solar atmosphere below
the corona. According to the scenario that has prevailed over the past
two decades or more, these electrons are somehow accelerated at or
above the flare loop (seen in soft X-rays), and emit radiations in
various wavelengths through various mechanisms.
It is still of interest to study the details of the interaction of
nonthermal electrons with plasma in the underlying atmosphere that is
cooler than the corona. One of
the investigations initiated but not completed by
the Solar Maximum Mission
(SMM) is how these electrons are responsible for UV emission,
which characteristically comes from 0.1 MK plasma. Is it through
direct heating or possibly changing the ionization? This question
should be answered through close comparison of spatially resolved
observations of hard X-ray and UV sources.
After the UVSP
instrument on SMM, however, we have not had spatially-resolved
UV observations. But now
TRACE can observe flares
in high cadence, especially in the 1600 Å channel. Therefore, over the
past two years, we have had several intense campaigns to observe
flares jointly with TRACE. This nugget reports on a preliminary
analysis of data taken in one of such campaigns.
Flares observed during Max Millennium Campaign #6
According to our
SXT-TRACE flare catalog, about 15 flares were observed jointly
by Yohkoh and TRACE during 15-24 March 2000 with varying
observational conditions and data coverage. Here, we concentrate on
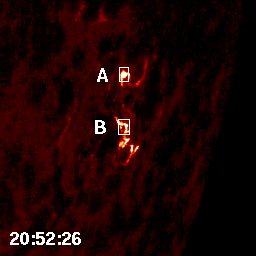
an M-class flare of 18 March 20:50 UT. This flare occurred in
AR 8906, then located at S16 W67. We identify two locations that
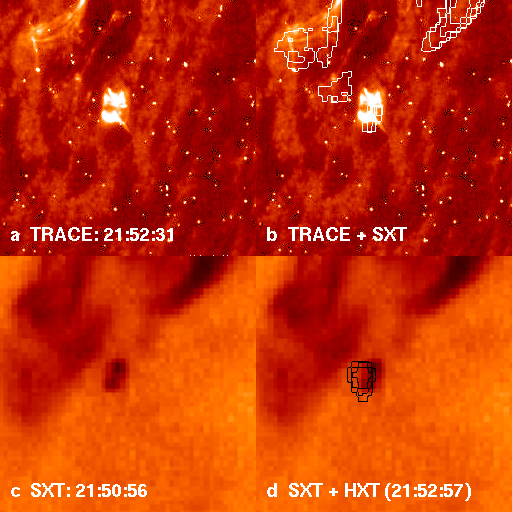
suddenly brightened as the flare started, as shown in the left figure below
(click to enlarge). We call the two locations "A" and "B".
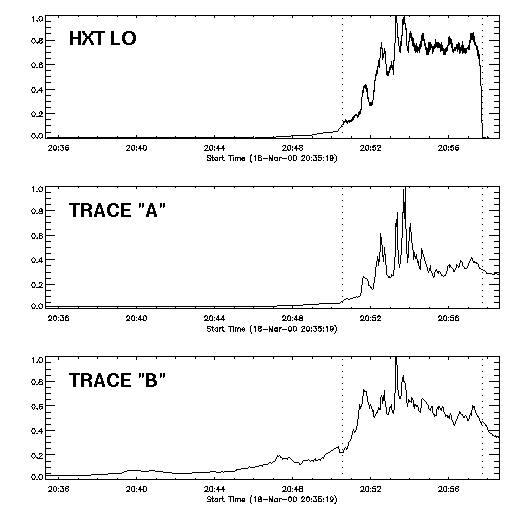
The 1600 Å intensity was measured at the two areas within "A" and "B"
as indicated by the boxes. In the middle figure,
the normalized light curves are given in comparison with the spatially
integrated light curve of the HXT LO channel
(14-23 keV). The sudden drop of the HXT count rate around 20:58 UT is
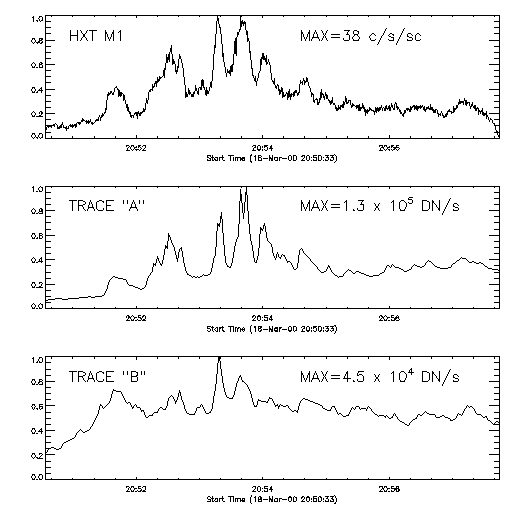
due to Yohkoh spacecraft night. In the right figure, the
interval between the two dotted lines is expanded, and the HXT M1
channel (23-33 keV) time profile is shown instead. We see that major
hard X-ray peaks appear in the UV light curves, although the ratio
between hard X-rays and UV does not appear to be constant.


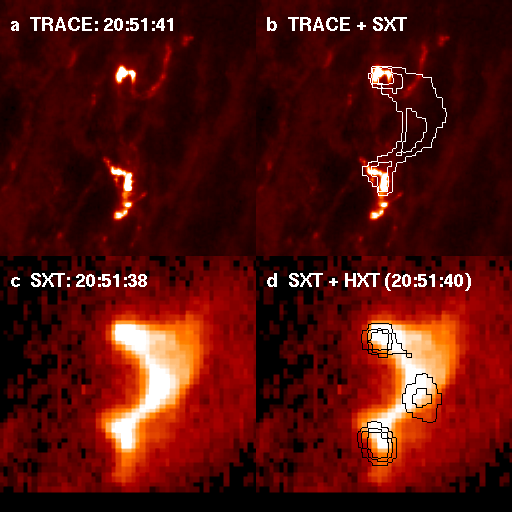
|
The left figure shows the relation of the TRACE 1600 Å images with
the Yohkoh SXT and HXT images. "A" and "B", which appear to
correspond to foot-points, are indeed
connected by a soft X-ray flare loop, and they are essentially
co-spatial with the hard X-ray foot-point sources.
But there are complications. The bright areas in UV are patchy with fine
structures, the soft X-ray loop is not isolated, with a hint of more
diffuse outer loops, and there is a third source in hard X-rays. We
can safely claim the third source to be a loop-top source, on the
ground that, unlike A and B, there is no UV emission at its position.
|
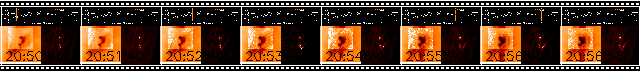
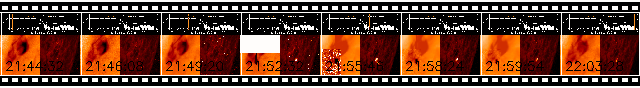
The following movie compares the evolution of the flare in soft X-rays
(left) and UV (right). The times of the images can be found in the
upper plot showing the GOES and HXT M1 light curves. The field of view
is 128 arcsec. Disregard the saturation spikes in the SXT images that
run vertically. We immediartely note that there is a third area in the
1600 Å images to the west of the southern footpoint. This seems to be
correlated with the apparent motion (outside the central flare loop)
to the northwestern direction in the soft X-ray images. Even outside,
we see a larger structure gradually "opening up", i.e., the southern
leg of a large-scale loop system moving southward. This probably signifies
an on-going coronal mass ejection (CME) associated with the flare.
mpeg (0.27 MB) or
Java script
(2 MB)
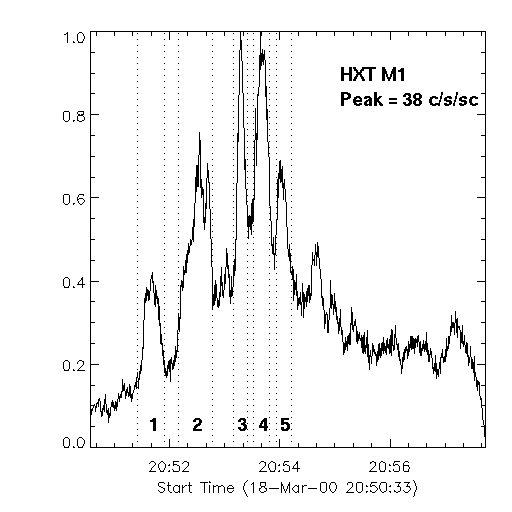
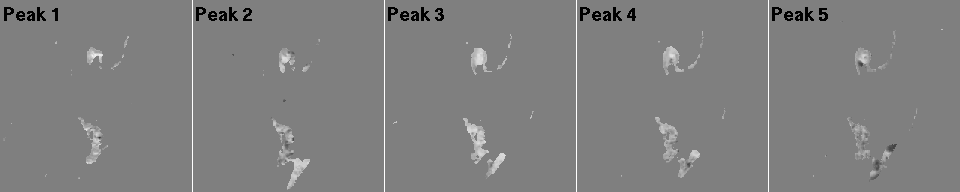
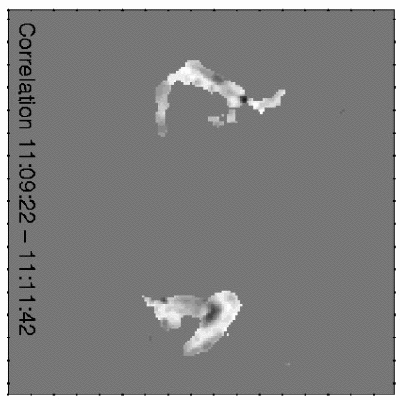
We now look at the hard X-ray and UV relation more closely over
individual intensity peaks. We identify five major peaks as indicated
in the left figure below. For each peak, the light curves of the TRACE
1600 Å images at all the pixels are correlated with the spatially
integrated HXT M1 light curve. The maps of the correlation coefficients
are given in the right figure (scaled to -1 and 1). We note that quite
large areas have good correlations with the hard X-ray variations, even though
not all the areas are co-spatial with the hard X-ray foot-points. Also, the
correlation generally becomes poorer in the later peaks. Part of the
reason for this may be that the loop top source grows in hard X-rays as the
flare progresses. A similar map of
the correlation coefficients for another flare in the same region on the
previous day was shown in
a nice paper by Harry Warren. It is
reproduced here, but it had to be
rotated 90 degrees to follow the usual convention that solar north is up.
The two areas in the 17 March and 18 March flares
represent essentially the same areas with respect to non-flaring structures,
even though the active region must have evolved in the meantime.

We have shown that the UV intensity is temporally and spatially correlated
with the hard X-ray intensity, but that it is not a rigorous
one-to-one correspondence.
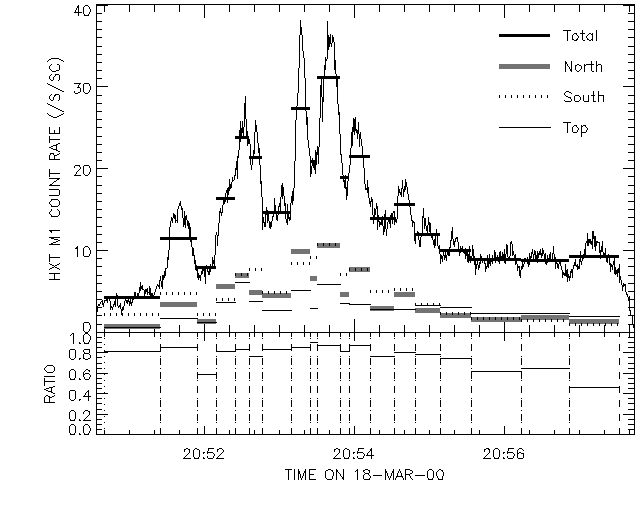
Hard X-ray images are much simpler than the the UV images, and this is
not due entirely to the different angular resolutions. It should be
remembered that HXT has a dynamic range of only about 0.1. This means
that getting spatially-resolved flux is quite difficult. The following
figure shows the light curves of the three locations, the northern and
southern foot-points and the loop top. This shows that the loop top
source becomes relatively brighter at later times. More importantly,
however, the lower panel shows that the counts included in the three
sources explain less than 80 % of the total counts, and more than 20% or
something like 50 % in the last interval is missing. This is a
result from the PIXON image reconstruction, and the missing counts are
much larger in the MEM images. This may be a technical detail, but
it provides a strong reason we hope
HESSI will go off without
further delay.


|
The 20:50 UT flare was followed by a smaller (C-class) flare about an
hour later, as shown in the left figure. This one is characterized by
a compact source. It shows a double structure, suggestive of conjugate
foot-points, in soft X-rays 1-2 minnutes before the flare onset and also
in UV. In contrast, HXT images show a
single source, which probably comes from one leg. HESSI would
tell us the nature of the single sources like this. It appears that
the TRACE 1600 Å images are saturated around the flare peak, so the detailed
analysis of the light curves does not seem to be possible for this flare.
Finally, the following movie shows that the flare is associated with
jets.
|
mpeg (0.12 MB) or
Java script
(1 MB)
Conclusions
We have given an example that shows good temporal and spatial correlations
between hard X-ray and UV emissions. The UV emission does not limit to
the footpoints of the flare loop in which nonthermal electrons are
supposed to travel, but it also signifies heating as a result of
mass motions. Actually, for the famous Bastille Day 2000 flare, we
saw both loop propagation and the associated brightening lower down in
the TRACE 1600 Å movie, more than 10 minutes before the X-class flare,
highly indicative of the relation between the CME and the flare in that
particular case.
The TRACE images do suggest that the footpoints have fine structures, which
may not be revealed by the present hard X-ray instrumentation. We acknowledge
that the TRACE 1600 Å channel has some complicated response because of several
strong lines in the pass band and the increasing continuum with wavelength,
but comparisons between TRACE and Yohkoh/HESSI will provide
useful information as to the transport of non-thermal electrons and the
conditions of the transition region and chromosphere.
19 October 2001
Nariaki Nitta (NVN)
<nitta@lmsal.com>.