
Introduction
The 10th anniversary of the Yohkoh launch took place in August 2001, and we have just completed a wonderful meeting to commemorate it. As one might expect from a mature program such as Yohkoh, the quality of the presentations was excellent; what one might not have expected was the real novelty of many of them.
This science nugget, and probably several following it, will present highlights from this meeting. The proceedings promise to be a rapid production, so all of the material will shortly become available.
H-alpha from Sartorius and hard X-rays
We start here with results from the Kwasan Observatory (Japanese-language page) in Kyoto, Japan, which operates an ancient (1910) refractor called the "Sartorius Telescope". The material presented here is taken from a presentation by A. Asai and is first on our list because so many participants selected this as a high point of the meeting.
The basic idea of the research is to use modern tools to understand the evolution of a two-ribbon flare more exactly. Since the 1950's we have suspected that large-scale magnetic reconnection in the solar corona can explain the pattern observed in the gradual phase of such a flare. The Grand Archive of flare cartoons has many sketches explaining how this works, but do not be misled - we understand some things about these processes, but not yet the really important ones. That is why the Asai presentation may lead to real progress.
Flare observations
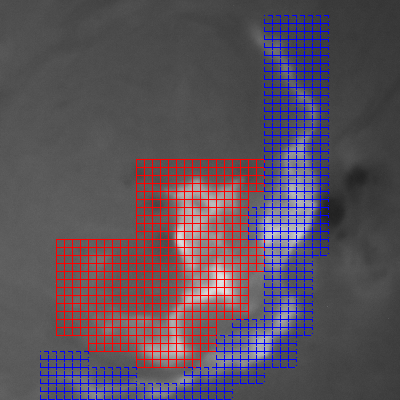
The reported flare took place April 10, 2001, and the H-alpha image below shows two nice flare ribbons:
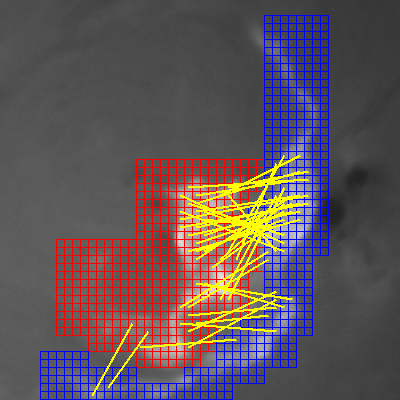
The new wrinkle here is to look for "conjugacy", which means the simultaneous time variability of two points in the chromosphere (H-alpha). This would establish that the coronal magnetic field includes a field line connecting these two points (see here and here for recent related studies). Ideally, as often proposed but never achieved very well, one could even track the reconnection of field lines by this means. If successful it would present very solid evidence for this elusive process. To do this A. A. and her colleagues have calculated the correlations between each point in one ribbon with each point in the other:
 |
 |
Hard X-rays
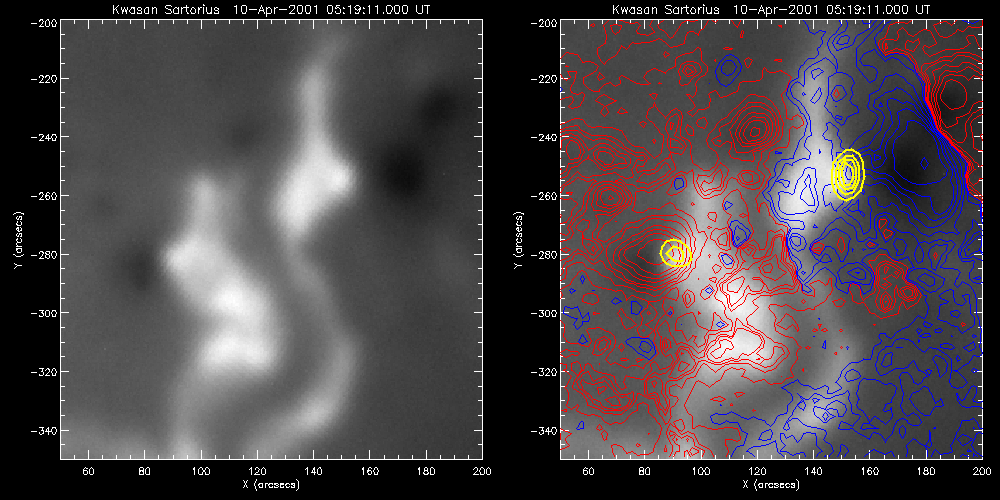
The next exciting bit of analysis is to find out where the hard X-ray sources fit into the ribbons (see here for a view of how this worked in the "Bastille Day 2000" flare). To this end A. A. and her colleagues show the following comparison:
Conclusions
It is really exciting to see modern data (the Sartorius telescope may have been built in 1910, but its CCD had not been; moreover X-rays had hardly yet been discovered by Roentgen). These data largely confirm the large-scale reconnection model for for the main phase of the flare, as so much other Yohkoh data also do, but this time with the hope of a quantitative link between energy release and magnetic geometry. Several groups are now working on related subjects with different data sets, including the papers cited above and more than one group at the Yohkoh 10th anniversary meeting.
H. Hudson (hudson@isass1.solar.isas.ac.jp), with thanks to Ayumi Asai.