 |
 |
How deep is a coronal hole?
In this science nugget we discuss how to observe coronal holes in detail; most of the work to date has been rather qualitative as regards the low corona one sees in soft X-rays. So the question "how deep" can be asked, meaning "how detectable." Of course if the field lines are actually open, the geometrical depth of a coronal hole is, well, the size of the solar system.
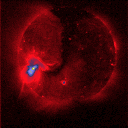
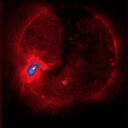
In 1996 the Sun did something remarkable. Although this was the depths of minimum of the sunspot cycle, nevertheless a single major active region appeared, giving us an X-class flare on July 7, 1996, and thereafter many CMEs. This "test pulse" of new magnetism in the corona also resulted in a clear distortion of the pattern of coronal holes, as predicted by standard models. What resulted was the "Elephant's Trunk" coronal hole, shown in the images below:
 |
 |
The difference between these two views is subtle. On the left is a single standard Yohkoh soft X-ray image, and on the right a sum of eight of them spaced out over a couple of hours. The perturbing active region (termed "non-asxisymmetric flux" by the pundits) can be seen on the left, and indeed the coronal hole droops down from the north pole in the manner of an elephant's trunk. For reference, Skylab had a well-studied "Boot of Italy" coronal hole.
These images, incidentally, are taken from the new "SSC" database of SXT images from Yohkoh. These have much-improved corrections when compared with our old "SFD" movie, and best of all they wil cover almost a full 11-year solar cycle with good uniformity. We will do a future nugget on the concept of this secondary database, which offers many opportunities for new research.
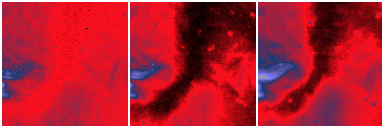
Let's look a little more closely into the subject of detectability. This coronal hole is a good test case for this too; since it occurred during solar minimum, the surrounding corona is a bit faint. Note that the boundary region of the hole is brighter on the left (east) than on the right (west), no doubt because of the presence of the active region.

The images above show close-up views, with better image registration, from respectively a single image, a sum of 10, and a sum of 37, thus with the effective exposure time increasing from left to right. The image on the right took a full day (August 26, 1996) to accumulate. Does this make the hole more visible, since the total signal has increased roughly proportional to the exposure time? One might be tempted to say "yes", but then why should the shape change? And why should the close-up on the left, a single frame, not show the hole so readily as the single-frame image shown at the top of the page? These are apparently artifacts of the representation and the boundary location, using such a representation, may mean very little quantitatively. We have used a lurid "color table" for display, and the displays self-scale between the maximum and minimum brightnesses of each image. They are therefore subject to fluctuations from noise.
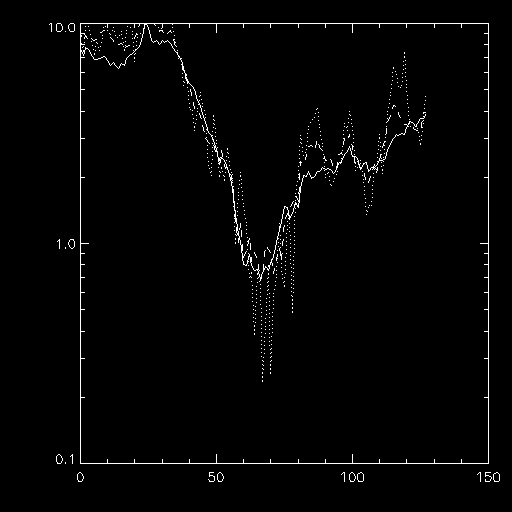
We take the next step in analyzing the shapes of the boundaries by making "cuts" across each image, at 1/2 the image height, and plotting the image brightness in that row of pixels. The figure below shows these cuts, for the three different image integrations, on a log scale:
 |
The plots show raw counts (DN) vs X position, where the full width is about 2/3 solar diameter. The deep notch is the coronal hole, and one can see that its "wall" height is about 10 times the base level (8 DN vs about 0.8 DN). The solid, dashed, and dotted lines refer to right, middle, and left images above: 37, 8, or 1 in the sum. Note the large scatter in the single-image brightness (dotted line); relative to the fainter corona on the west boundary (right) the hole is only defined with a signal-to-noise ratio (SNR) of about 3. The coronal hole is not very "deep" because the corona is faint. It is much better in the one-day average, with a depth (SNR) of perhaps 30.
The line plots show also, incidentally, how deceptive the images were about the shape of the hole. The width does not differ much with the different integrations.
March 22, 2002
H. Hudson (HSH) (hudson@sag.lmsal.com)