Recalculating SXT Temperature Response Functions
(April, 2010 by Aki Takeda)
(October, 2010, revised: uncertainty analysis added.)
(February, 2011, revised: photospheric abundance added.)
(March, 2011, revised: made into a simplified version.)
1. Introduction.
What is the SXT temperature response functions?
- Practically, they are the files in the SolarSoft made for Yohkoh/SXT,
used for temperature analysis (through the filter ratio metnod). They are
found in $SSW/yohkoh/sxt/response/ and have a prefix,
'sre_'.
- Physically, they are the expected number of photons which will be
detected by the CCD (or the number of electrons produced by them) through
each analysis filter. They are calculated for the isothermal plasma with
the emission measure, 10^44 cm^-3.
- Mathematically, they are the
SXT's effective area functions convolved with the synthesized solar
spectra. The former is the spectral response (spectral sensitivity)
modified by each analysis filter. The latter is calculated for a given
elemental abundance and ionization balance under a certain emission model
of the solar spectra. Examples of continuum
and line spectra.
As of 30-Apr-2010, our official SXT response function was the one made in
1995 April. It is based on the spectral model calculated by Mewe et.al.
(1985, 1986).
Since early 2000s, however, the new atomic data and the spectral models
became available from the Chianti atomic database for the plasma in the
X-ray range. Through a few upgrades, they are now considerably matured
at the current latest version, 6.0.1. It is therefore a timely effort to
update the SXT response functions based on the most recent database and
made them available for the general users of the SXT data.
Details are described in Takeda (2011).
2. New response functions.
The response functions are influenced by the following three factors.
- Elemental abundance :
??? true abundance of the observed corona ???
- Ionization balance :
------------------ trust the most recent result, 'chianti.ioneq'.
- Emission model (cont.& lines) :
--- trust the most recent model, Chianti ver. 6.0.1.
We provides three types of response functions according to the three
elemental abundances available in the Chianti database, version 6.0.1,
so that users can select from them as desired.
The new response files and the software to utilize them are
downloaded from here.
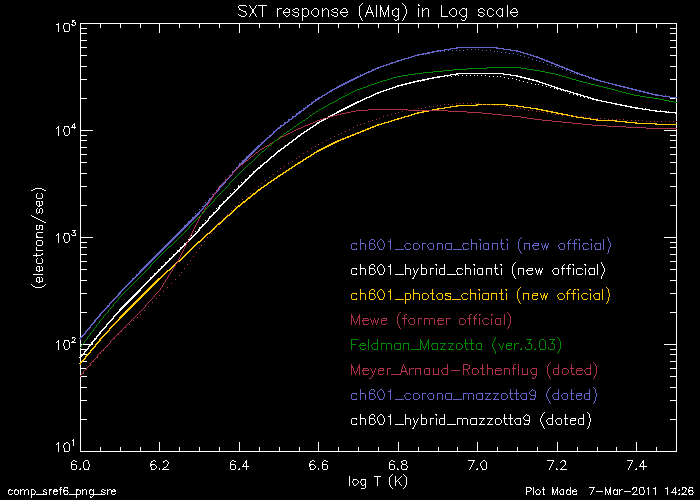
- (a) sun_coronal_ext.abund + chianti.ioneq (sre_ch601_corona_chianti.genx)
- (b) sun_hybrid_ext.abund + chianti.ioneq (sre_ch601_hybrid_chianti.genx)
- (c) sun_photospheric_grevesse07.abund' + chianti.ioneq (sre_ch601_photos_chianti.genx)
The former official responses and those calculated by Shimojo et al. (2002)
correspond to the following pairs.
- (d) Meyer's coronal abund. + Arnaud-Rothenflug's ioneq. with Mewe's emission model
(sre950419_02.genx : former official function)
- (e) feldmann.abund + mazzotta_etal.ioneq
(sre020507_01.genx : courtesy of M. Shimojo with Chianti ver 3.0.3)
For the purpose of making clear the source of difference, the following response
functions are also plotted as references.
- (f) meyer_coronal.abund + arnaud_rothenflug.ioneq
(sre_ch601_mayer_arnaud.genx : same pair as the former official function but
calculated with Chianti 6.0.1, for comparison)
- (g) sun_coronal.abund + mazzotta_etal_9.ioneq
(sre_ch601_corona_mazzotta9.genx : to check the effect of different ioneq file,
for comparison)
- (h) sun_hybrid.abund + mazzotta_etal_9.ioneq
(sre_ch601_hybrid_mazzotta9.genx : to check the effect of ioneq., for comparison)
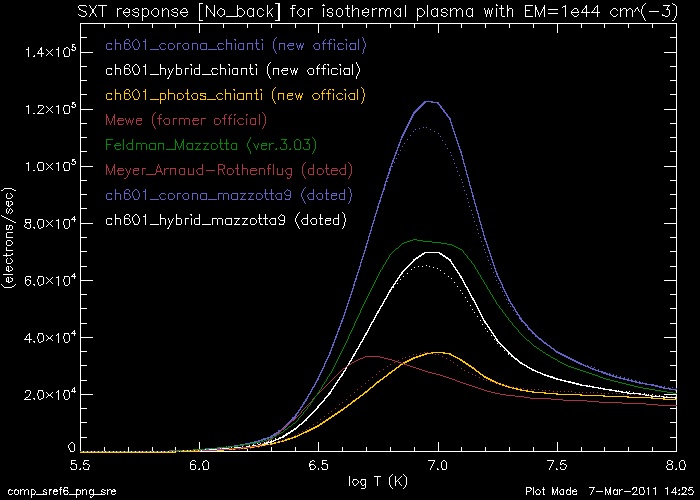
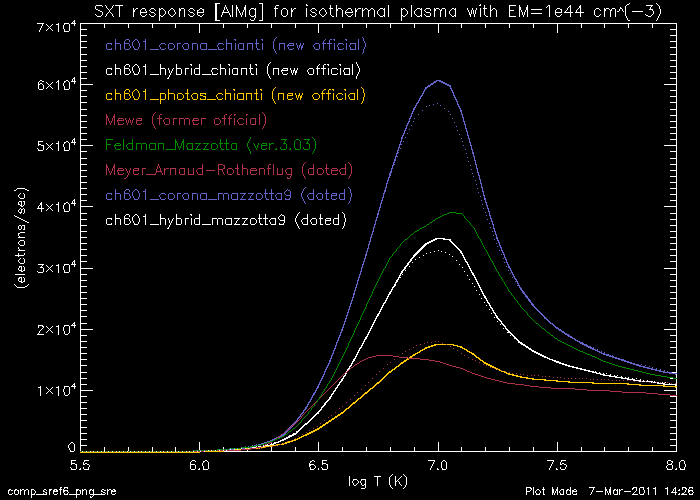
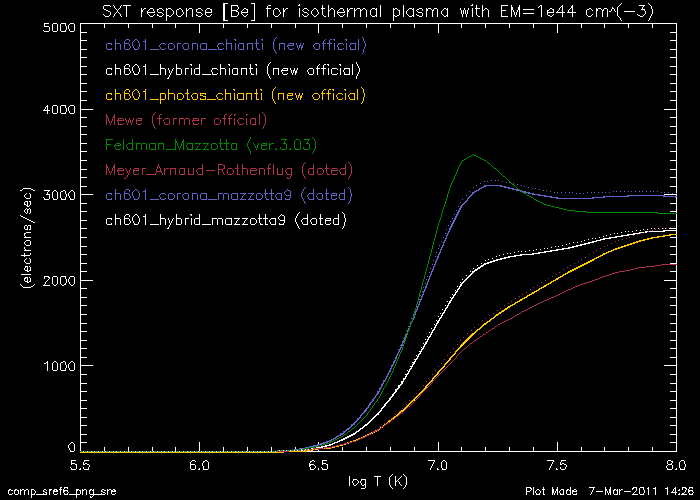
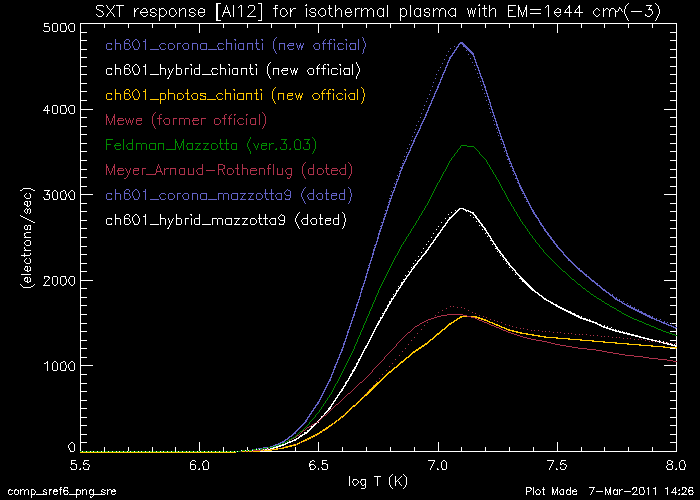
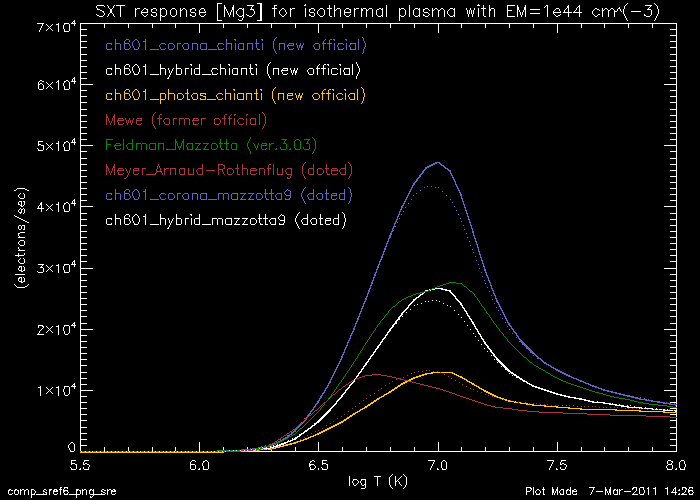
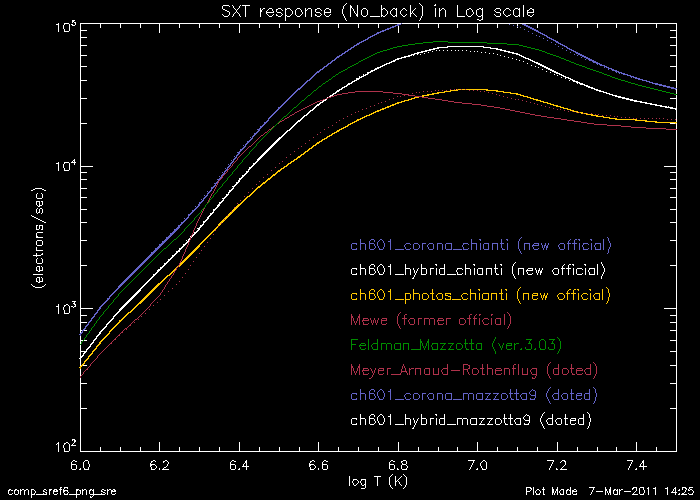
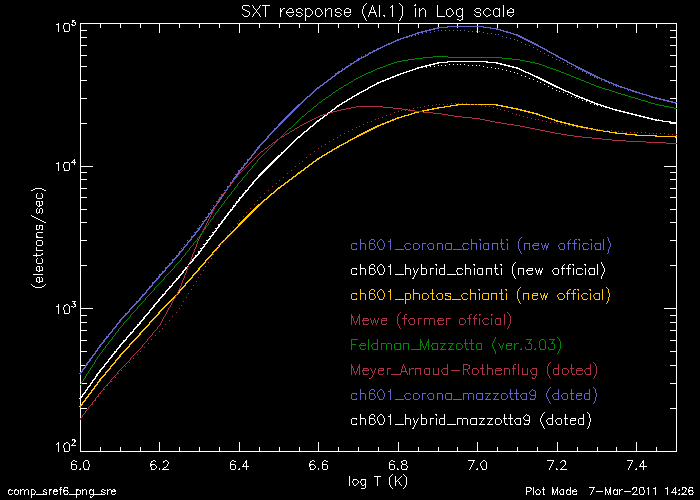
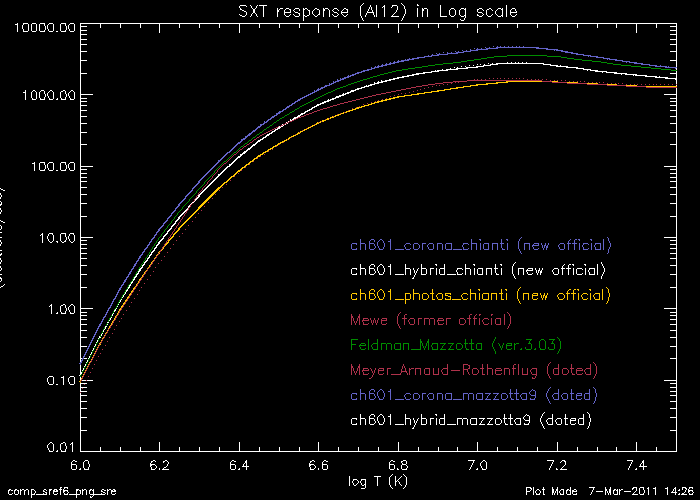
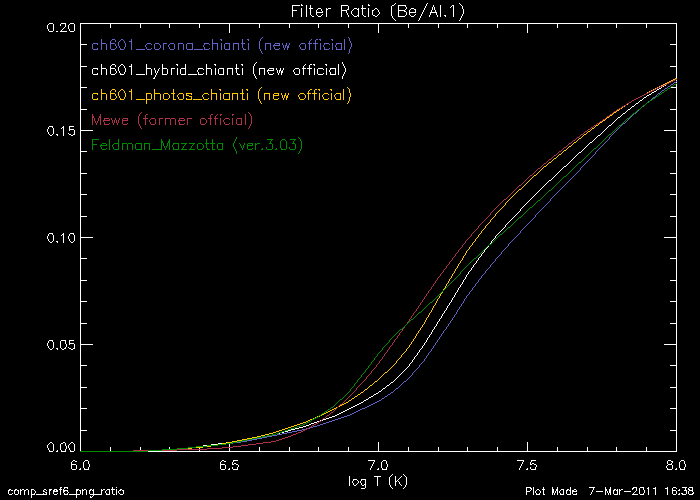
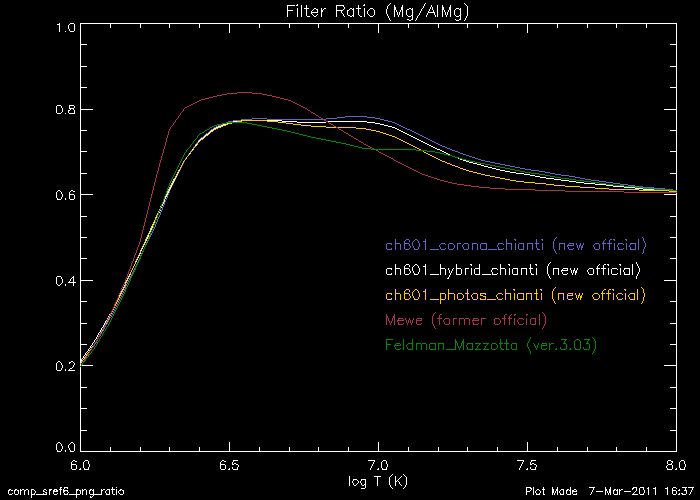
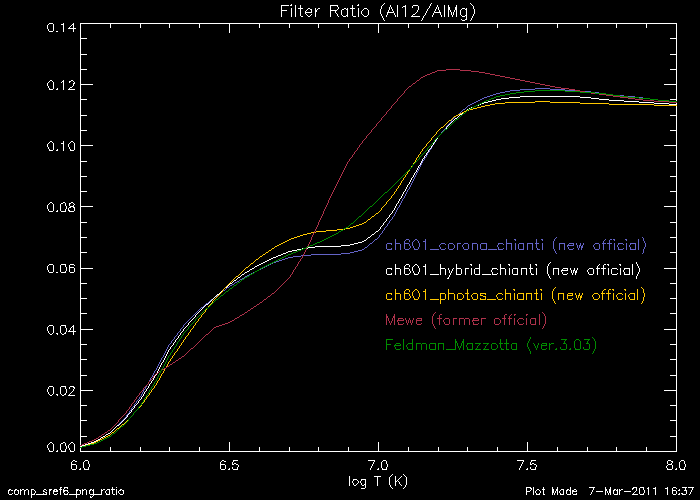
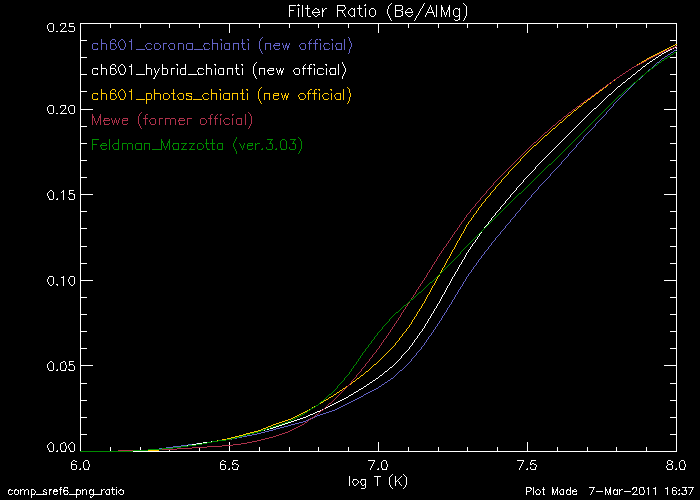
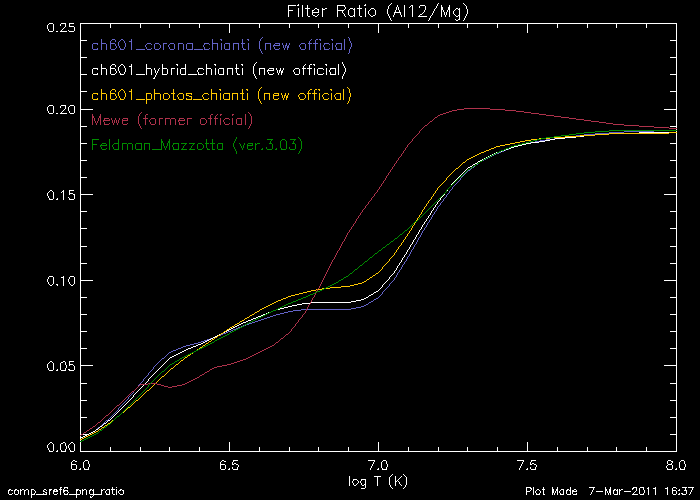
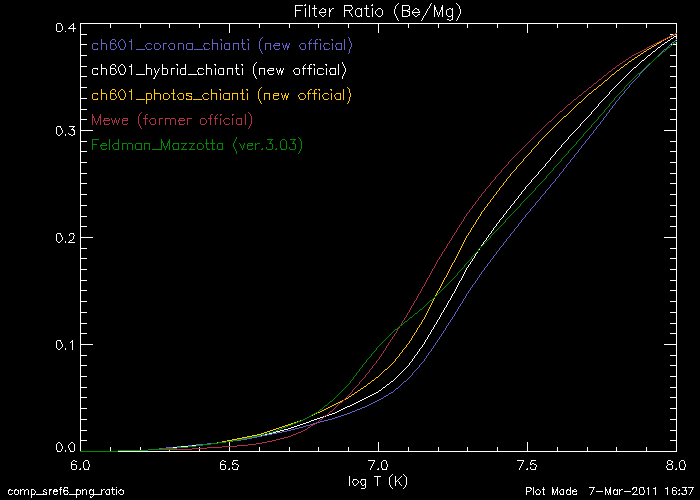
3. Comparison of New/Old response files.
New and old response curves for each analysis filter(filter B, in our convention),
in linear and logarithmic scales.
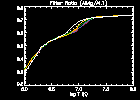
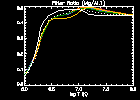
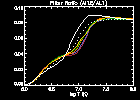
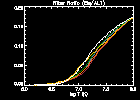
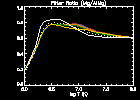
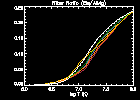
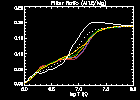
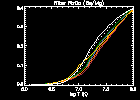
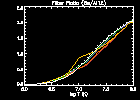
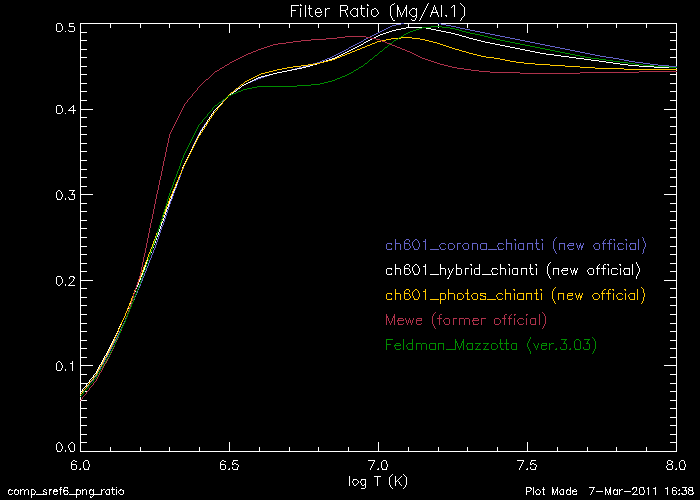
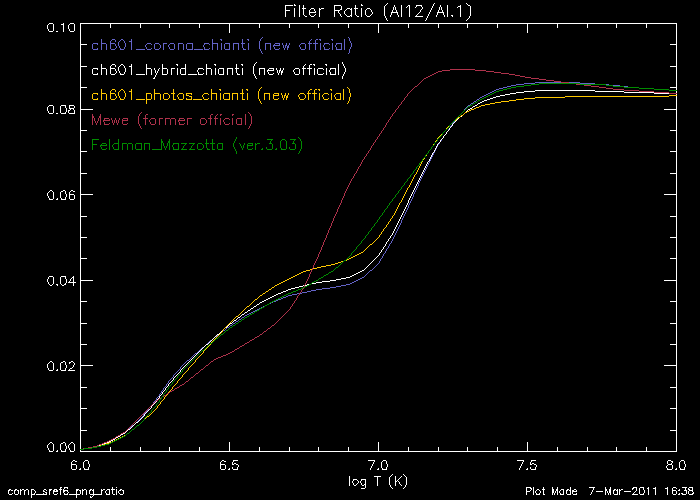
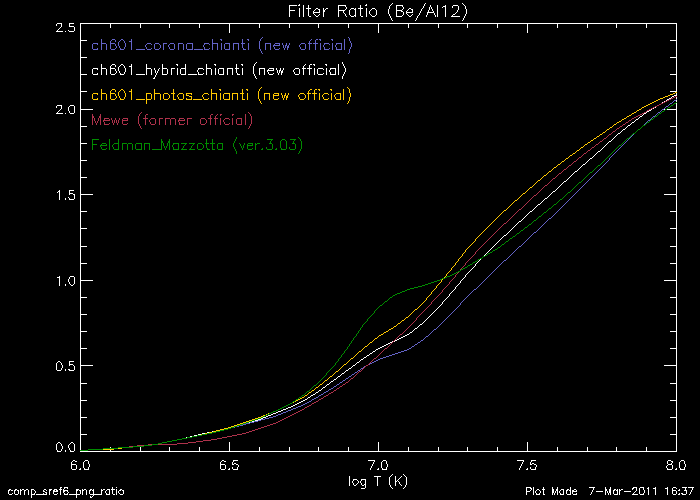
Line ratios of the all filter pairs.
For simplicity, only curves, (a) to (e) are plotted.
| AlMg/Al.1 | Mg/Al.1 | Al12/Al.1 |
Be/Al.1 | Mg/AlMg |
 |
 |
 |
 |
 |
| Al12/AlMg | Be/AlMg | Al12/Mg |
Be/Mg | Be/Al12 |
 |
 |
 |
 |
 |
4. Information summary of the files used for our calculation.
4.1. Elemental abundances
We compared the following abundance files.
- sun_coronal_ext.abund
- Feldman, et al.,1992, ApJ SS, 81, 387.
- Potassium abundance: Landi, Feldman and Dere 2002, ApJ, 139, 281.
- Li,Be,B,F,P,Cl,Sc,Ti,V,Cr,Mn,Co,Cu and Zn abundances:
Grevesse N., Sauval A.J., 1998, Space Science Reviews, 85, 161,
(photospheric values) with low-FIP elements increased by a factor 3.5.
- sun_hybrid_ext.abund
- Fludra, A. & Schmelz, J. T., 1999, A&A, 348, 286.
- Li,Be,B,F,Sc,V,Mn,Co, Cu elemental abundances:
Grevesse N., Sauval A.J., 1998, Space Science Reviews, 85, 161.
Their values have been scaled to mimic the "hybrid" FIP effect
found by Fludra & Schmelz 1999: Grevesse high-FIP abundances have
been decreased by a factor 1.3, Grevesse low-FIP abundances have
been increased by a factor 2.09.
- sun_photospheric_grevesse07.abund
- Grevesse N., Asplund, M. & Sauval A.J., 2007, Space Science Reviews, 130, 105
- The latest set of "standard abundances" produced by Grevesse et al.
Slightly differs from the former version, Grevesse N., Sauval A.J., 1998.
- meyer_coronal.abund
- Meyer, J. P., 1985, ApJ SS, 57, 173.
Plot of comparison among these three files is
here.
The text version is here.
4.2. Ionization equilibrium
We will compare the following 3 abundance files.
- chianti.ioneq
- Dere et al., 2009, A&A, 498, 915
- mazzotta_etal.ioneq
- Mazzotta, P., et al., 1998, AASS, 133, 403
- arnaud_rothenflug.ioneq
- Arnaud, M., Rothenflug, R., 1986, AASS, 60, 425
Plots of comparison among these three files for Fe ions.
Chianti and Mazzotta_etal and
Chianti and Arnaud_Rothenflug.
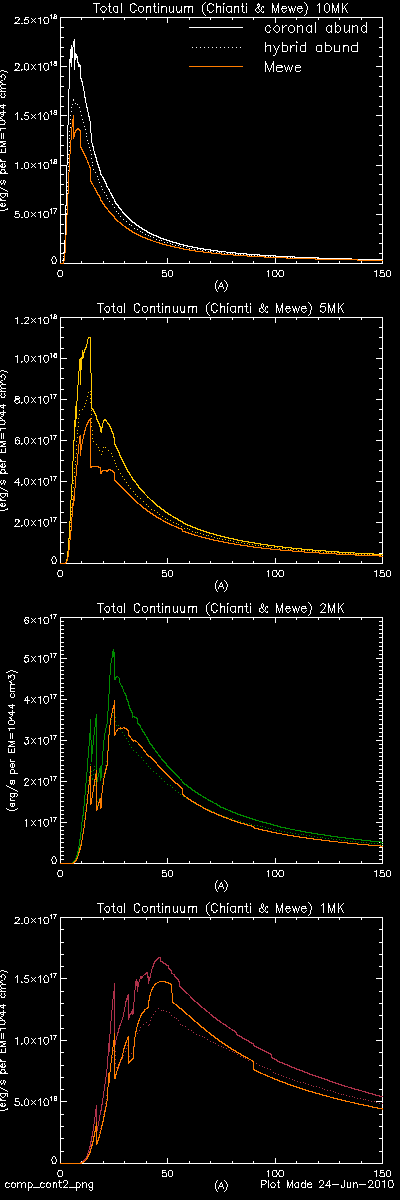
4.3. Continuum intensity from the isothermal plasma
The temperature dependance of the three atomic processes contributing to
the continuum intensities (free-free, free-bound, and two photon) is
here.
The total continuum intensity (the sum of the three processes) from
the 5MK, 2MK, and 1MK isothermal plasma is shown
here, and
these are the comparison with Mewe's results.
4.4. Line intensities from the isothermal plasma
The Chianti line intensities calculated with coronal_ and hybrid_
abundances are compared with Mewe's calculation in
here.
The dependance on the electoron density checked using coronal abundance
and chianti.ioeq are here.
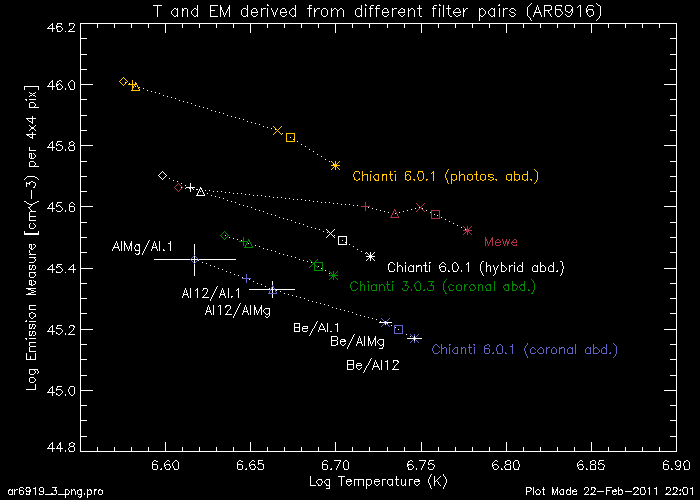
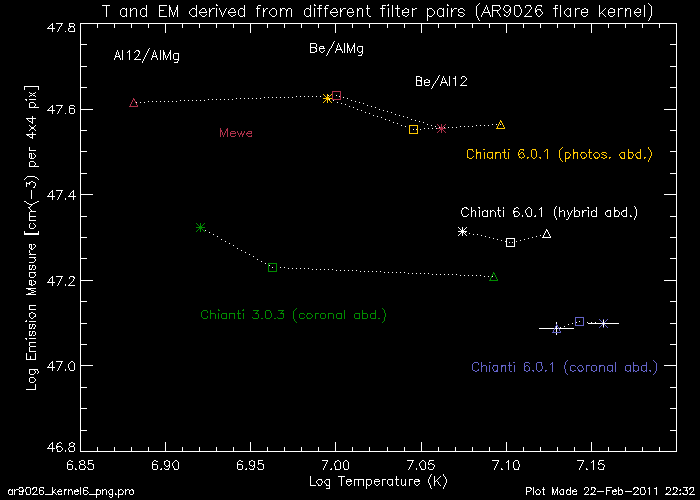
5. Examples of the temperature and emission measure analysis
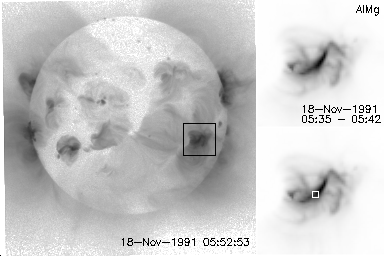
- AR6919 observed on 18-Nov-1991, 05:39.
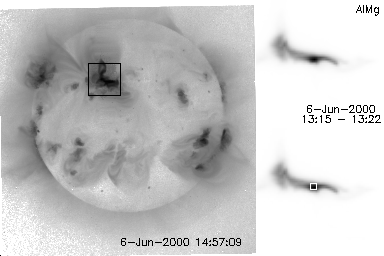
- AR9026 observed on 06-Jun-2000, 13:20.
The trend of temperatures derived from the Be/Al12 filter pair :
For AR9026 flare kernal, the latest response functions give higher value
(30 to 45%) than the traditional response file by Mewe.
However, the AR6916 has the opposite trend. This difference comes from
that two region uses different range of Be/Al12 filter ratio curve,
as show in here.
For a given filter pair, the different versions of filter ratio can yield
very close temperatures to each other (e.g., at around the intersection
of the ratio curves). However, the emission measures derived from them
differ substantially in most cases, because of the significantly different
intensity of the response functions. As seen in the above figures, the
data points appear as quite differnt from those from other versions of
ratio curve. The differences are, in most cases, significantly larger
than the amount of the calculated uncertainty that includes both
statistical and systematic errors.
Even with more reliability on the latest Chianti emission model than older
versions, the variation resulting from different abundance remains as a
dominant source of uncertainty associated with the current analysis method.
Proper choice of abundance (if at all possible!) is desirable for narrowing
the range of uncertainty.
References
Mewe, R., Gronenschild, E. H. B. M., and van den Oord, G. H. J.: 1985,
Astron. Astrophys. Suppl. Series 62, 197.
Mewe, R., Lemen, J. R., and van den Oord, G. H. J.: 1986,
Astron. Astrophys. Suppl. Series 63, 511.
Shimojo, M., Hara, H., and Kano, R.: 2002, COSPAR Colloq. Ser., 13,
Multi-Wavelength Observations of Coronal Structure and Dynamics,
ed. P.C.H. Martens and D.P. Cauffman (Oxford Pergamon), 419.
Takeda, A. : 2011, Sol. Phys., 273, 295.


