The purpose of this section is to help the user access the BCS data using the various pieces of BCS software that have been written. All the routines discussed use the reformatted database; IDL code assumes IDL Version 3 (or greater). Note that some of the widget-based IDL routines only work with more recent releases of IDL.
This document only presents an outline of how to use the routines. Please use the IDL routines DOC_LIBRARY, XDOC and CHKARG, together with the Reference Guide chapter for further information on any particular routine.
There are several additional documents that describe different parts of the BCS software. All are kept on $DIR_BCS_DOC; in particular:
Notes:
Section 3.1 details how to first access the BCS data. To do detailed analysis work on the spectra, see sections 3.3 and E.1; otherwise, use the routines in section 3.2. Several other useful BCS routines are summarized in section A.2.
Basically here we are asking why are you wanting to look at BCS data. This is because the approach used to access the data if you are interested in a particular time is different from that used if you are trying to find the occurrence of a particular type of event without any a priori knowledge of its occurrence.
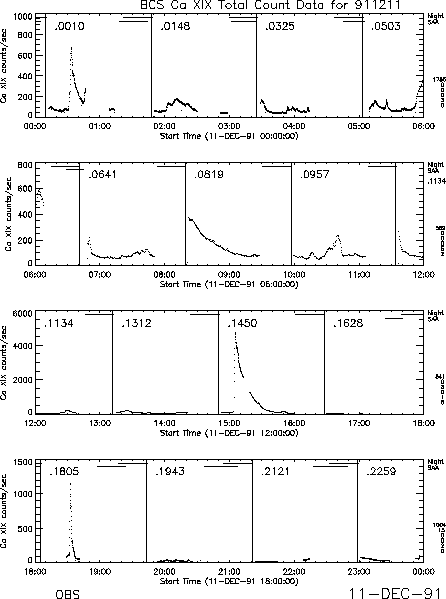
If you are interested in a particular time interval, you have probably found out that there is an event from the book of BCS Ca XIX light curves, SA plots, PLOTY plots, GOES light curves, the event lists, the occurrence of a flare flag or from something seen in another instrument. In this case, the way to proceed is to use YODAT or WBDA.
YODAT is a general purpose routine that will access all types of Yohkoh data, together with certain datasets from ground-based observatories. The detailed operation of YODAT is described on page 2.3.1, but here we present a short summary.
After starting YODAT (within IDL) the user must select a BDA file (or files). YODAT reads in the roadmap of the selected file and the user must then decide on which further selection procedure to use. The user can:
A widget-driven interface that allows the user to examine any BDA file on
the data directories (or to display and accumulate the contents of a BDA
file already read in using YODAT) is the procedure WBDA. This routine
allows the user to interactively work with the data. If the data and index
array have not already been read in using YODAT, it is recommended that a
specific date be requested when running WBDA; a question concerning the
required date is asked if WBDA is called without any input parameters.
IDL > wbda,index,data
IDL > wbda

These routines (except where stated) assume that the required spectral data has already been read in (e.g. using YODAT).
The data extracted from the BDA file is in compressed form and is not
normalized for the integration time. Also, spectra from all channels
are included in the data array and extraction of a channel may be
needed before the data can be properly displayed.
A single channel can be extracted from the BDA data array, and
then decompressed and normalized for integration time using
BCS_DSPEC. By default, channel 3 data are returned.
IDL > chan_data = bcs_dspec(index,data)
IDL > chan_data = bcs_dspec(index,data,chan=n [,etc.])
Essentially, this is the same as the following expression, but
BCS_DSPEC also does some additional things.
IDL > chan_data = bcs_norm(index,bcs_decomp(ext_bcschan(index,data,channel)))
If you are interested in what modes the BCS was executing, or what the
count rate in a particular channel was at a particular time, this can be
determined by using LIST_BDA. The procedure will work on either the
roadmap or the index structure (which must have been read in with YODAT).
By default, the count rate for channel 3 (Ca XIX) is given in the listing.
IDL > list_bda,roadmap,start_rec,nrec [,chan=n, etc.]
IDL > list_bda,index,start_rec,nrec [,chan=n, etc.]
These routines only plot light curves. Examples of calls to available
routines are:
IDL > lcbda,index [,chans=[2,3,4],psym=psym,/log]
IDL > plott_bda,index
IDL > plott_bda,roadmap,psym=psym
The light curve, and spectra at times selected from the light curve, may
be displayed using WBDA. This is an interactive, Widget-driven
program. Notes: (i) WBDA can work either from extracted data, or can
extract its data directly from the BDA file; (ii) the spectral plots
are versus wavelength.
IDL > wbda,index,data
Times can be selected by the cursor from a light curve and summations
overplotted together with a light curve using BCS_SURVEY.
IDL > bcs_survey,index,data [,chan=n [,/norm , etc]]
Spectra summed over times selected by the cursor from the GS greyscale can
be plotted with GS_SP (which displays four spectra).
IDL > .run gs_sp
There are several variants of a routine that plots spectra from several
channels and a light curve on a page. In due course, these will be
combined into one program. These routines display a light curve and
three spectra)
IDL > .run vg
IDL > .run gs_vg
A plot with a spectrum for each channel stacked one above the other
may be produced with PLOTS_BDA; the user can page through the modes
if more than one is passed in the arrays to the routine.
IDL > plots_bda,index,data
Many spectra from the same channel may be plotted on a page as a
matrix with the routine BCS_MULTI.
IDL > bcs_multi,index,data [,chan=n, etc.]
MPLOT allows the user to overplot many spectra from the same channel,
optionally displacing each one in the x- and/or y-direction.
Note that the BCS channel must have been extracted before
calling this routine (see earlier in this section).
IDL > mplot,xvals,chan_data,x_spacing,y_spacing
The evolution of spectra against time can be displayed as a contour map by
BCS_CONT, or as a greyscale image using DISP_BDA and GS. Note: The time
axis of BCS_CONT is uniform, but those of DISP_BDA and GS are not.
Example calls of these routines are:
IDL > bcs_cont,index,data [,chan=n, range=[n1,n2], etc.]
IDL > disp_bda,index,data
IDL > .run gs
After selecting a time interval with YODAT, a movie of the changing spectra
for a given channel may be displayed by BCS_SPMOVIE. Note:
this program will only run on an X-windows workstation.
IDL > bcs_spmovie,index,data [,chan=n, etc.]
Overplot several spectra to show evolution of blue wing and line width
with PLOT_REF.
IDL > plot_ref,index,data,channel,dset_arr [, etc.]
Plot light curves of different regions of the spectra selected by cursors.
Note: With GS_LC, the time period must first have been selected from the
GS greyscale display with GS_CUR.
IDL > .run gs_lc
BCS data that have had instrumental corrections and calibrations applied to them are referred to as BSC data. BSC stands for BCS Spectrally Calibrated data which has had crystal curvature corrections applied and has been converted to photons cm-2 s-1. For quantitative work with BCS spectra the user should always begin by constructing the BSC data structures from the raw data files. This IDL-based software replaces that FORTRAN code that was previously used (see the section on BSD Analysis Software); hopefully this will eliminate some of the difficulties encountered in the installation of the FORTRAN code on the various Unix and VMS platforms. The routines are outlined here, but more information can be found in the BCS part of the reference manual.
The routines work with structures that are compatible with all the other instrument structures in the Yohkoh database. An outline structure (the BSA structure) containing a specification of what data are to be extracted from the BDA file is first created by MK_BSA, and then the BSC structure (and optionally a BSC file) is assembled by the routine MK_BSC.
First run YODAT to extract the index and data arrays from the BDA file for
the selected time interval. Make sure to ask for the DP_SYNC data.
The routine MK_BSC is then called as
follows:
IDL > mk_bsc,index,data,bsc_index,bsc_data,dp_sync=dp_sync
IDL > mk_bsc,index,data,dp_sync=dp_sync,/file
The second case will write the corrected data to a BSC file.
The following routines are used in the assembly of the BSC file:
    BCS_ACCUM     accumulates BDA data into a BSC structure.
    BSC_XCORR     applies curvature corrections to BSC data.
    BSC_FLUXCAL   applies flux calibrations to BSC data.
    BSC_ERRCAL    computes uncertainties for the BSC count spectra.
If the /file option is not used when calling MK_BSC, a BSC file may be written using SAV_BSC. An existing BSC file may be read in with RD_BSC and, after modification, again a new file may be written with SAV_BSC - see the Reference Manual for more details.
The contents of the BSC file or structure may be examined using LIST_BSC.
IDL > list_bsc,bsc_index,chan
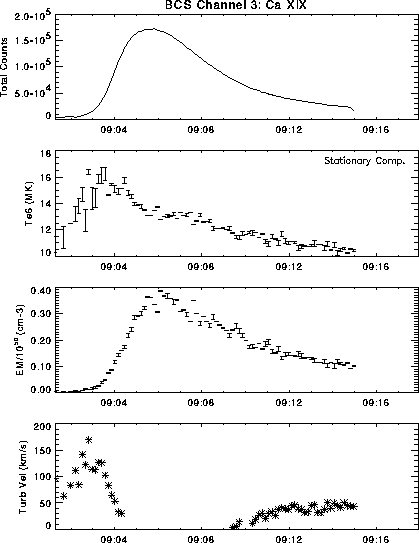
BCS spectra that are held in a BSC structure my be fit using the
routine FIT_BSC.4
In the following example of a call to the routine, the results of the
fit are returned in the parameters fit_index and fit_data:
IDL > fit_bsc,bsc_index,bsc_data,fit_index,fit_data,chan=n
IDL > fit_bsc,bsc_index,bsc_data,fit_index,fit_data,ss=ss
All channels and all spectra are fit if no selection is specified. In
addition to the chan and ss keywords, there are many other keyword
parameters that specify of the range of the fit, allow the input of
starting guesses of electron temperature and other parameters.
Note: FIT_BSC is relatively new and is still under development.
Compare a measured spectrum (selected using an ss vector from
several contained in bsc_index and bsc_data) to spectra calculated using
BCS_SPEC (for channel chan, at a temperature of Te6 MK) using the
routine BCS_SPEC_PLOT. An example of the sequence of calls required
to do this is given below:
IDL > bcs_spec_plot,bsc_index,bsc_data,ss=ss
IDL > spec=bcs_spec(chan,Te6,wave=wave [,etc])
IDL > bcs_spec_plot,wave,spec,/over
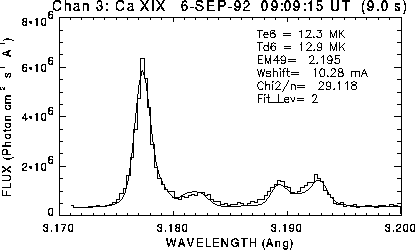
The light curve and spectra selected from the light curve (from the BSC
file or structure) may be plotted with PLOT_BSC.
This program may be used interactively if desired, and can also be
used to overplot fitted spectra (if FIT_BSC has been called with the data).
If there are multiple spectra, PLOT_BSC will provide a widget
interface to select the spectrum to plot. An example is shown in
Figure 3.3 which plots data which has been fit using
FIT_BSC.
IDL > plot_bsc,bsc_index,bsc_data,chan=n
IDL > plot_bsc,bsc_index,bsc_data,chan=n,fit_index,fit_data


See the routines listed in the Appendix of this User's Guide on page A.2.